
.avif)
Australia
Australia

Melbourne
- Due to high winds, several container parks have been experiencing intermittent closures. This will have an impact on container collections and dehires.
- Protests at the Port of Melbourne are stirring up trouble for landside ops - not a full-blown strike, but enough to keep truckies and staging areas on edge. A few operators have already reported missed slots and container pick-up delays, with staging windows slipping.
- Importers: stay tight with your transport providers and consider shifting to off-peak slots to dodge the worst of it.
- With Melbourne pulling a huge share of Australia’s inbound trade, even “small” disruptions like this can ripple quickly through delivery schedules.
Sydney
- ANL has introduced a Port Congestion Surcharge for Sydney. This surcharge is being applied because of ongoing delays and congestion at the port, which are impacting vessel schedules and disrupting container flow. The fee is intended to help cover additional operating costs caused by these inefficiencies and to encourage more predictable booking and delivery behaviour.
Upcoming Public Holidays
- VIC: Friday 26th September – AFL Grand Final Public Holiday
- WA: Monday 29th September – King's Birthday
- NSW/SA/QLD: Monday 6th October – Labour Day
North East Asia
North East Asia

The National Day pre-holiday push has officially begun. Traditionally, volumes ramp up from around September 21, though the peak is never as intense as Chinese New Year, when factories close for several weeks. This year, Golden Week coincides with the Mid-Autumn Festival, meaning demand is firm and comparable to previous years.
At the same time, rates on other trade lanes continue to collapse. China–Middle East base ports are now down to significantly reduced levels, a direct consequence of regional instability and a sluggish global economy. With capacity shifting, extra-loader vessels are being pushed onto the Australia route, including MSC’s 8,000 TEU giant due later this month. This is one of the key reasons rates are sliding further into late September.
Market Outlook
- Short-Term: Rates valid until September 30 reflect heavy discounting as carriers fight for market share.
- October 1–14: Market expected to hold steady.
- After October 15: Multiple blank sailings (8–9 already announced) should lift rates, provided no additional extra-loaders enter the frame.
September started out looking stable, but the balance has already been thrown off. With rates falling, blank sailings looming in early October, and pre-holiday demand colliding with excess capacity, the market is entering another period of volatility. We hope that by mid-to-late October, carriers will recalibrate and stability will return – provided ad-hoc sailings don’t undermine the fragile peak season.
Ocean freight rates

Rate Summary: 21st - 30th September
- Most Competitive Services: Rates dropped aggressively to between USD1100 - 1150 per TEU from China base ports to the East Coast. An ongoing rate war between these carriers is driving the floor of the market.
- Mid-Tier Services: Rates are averaging out between USD1150 - 1250 per TEU across mid-range carriers. Carriers are trying to build a roll pool ahead of Golden Week, resulting in competitive price levels for this period.
- Premium Services: A3 carriers held firm initially, but are now offering reduced rates for the second half of September. Rates vary between USD1350 - 1500 per TEU. No indication of further rate cuts for now. Heavy demand for this service.
- Australia West Coast: Ongoing congestion in Singapore has led to increases in the West Coast rate levels. Rate levels currently vary between USD1100 - 1350 per TEU.
The pre-Golden Week market is a perfect storm: promotional rates, extra-loader capacity, and a looming wave of blank sailings. Rates will remain under pressure through September, but all eyes are on mid-October, when supply cuts could trigger the next round of increases. Until then, importers can benefit from rock-bottom pricing, but the reprieve won’t last.
Advertised GRIs/PSS
- Most of the advertised September GRIs failed to materialise for the remainder of this month. Due to this fact, additional increases for September are unlikely.
- ANL: USD300.00 per TEU GRI for all cargo from South East Asia, Indian Sub-Continent & Middle East to Australia
Capacity and schedule reliability

Northern China’s big three – Shanghai, Ningbo, and Qingdao – are still feeling the squeeze with vessel backlogs and heavy berth congestion.
Ningbo: Average wait time is sitting around 2.25 days, made worse by dredging work at YZCT and CMICT.
Shanghai: Vessels are waiting about 2.1 days on average.
Qingdao: Average delay sits at 1.36 days, but some carriers are reporting waits of up to 3 days.
Yantian: Slightly better at 1.14 days, though congestion still causes headaches.
South East Asia
South East Asia
.avif)
Ocean freight rates

Southeast Asia recorded only modest shifts in the second half of September. Across Singapore, Indonesia, and Malaysia, most carriers implemented rate increases of 5–7%, reflecting steady but contained upward pressure.
At the premium end of the market, however, volatility was more pronounced, with average rate hikes reaching 11% across the region, highlighting stronger fluctuations among higher-tier carriers.
Capacity and schedule reliability

Capacity
Additional Loaders:
- TS QINGDAO - 1909 TEU - SHK 13/Sep→ NSA 14/Sep→ BNE 26/Sep→SYD 26/Sep→MEL 1/Oct
- TS MELBOURNE - 2954 TEU - Tianjin 15/Sep→ TAO 16/Sep→ SHA 18/Sep→NGB 19/Sep→SHK 22/Sep→ NSA 23/Sep→ BNE 06/Oct→SYD 9/Oct→MEL 11/Oct
Blank Sailings/Delays
Week 38:
- A3: COSCO SINGAPORE V.193 - Delayed by 5 days
- NEAX: ITAL USODIMARE V.0185S - Delayed by 4 days
- AUN: MAERSK FUKUOKA V.536S - Delayed by 3 days
- CAT: DIMITRA C V.2355S - Delayed by 3 days
Week 39:
- PANDA/ZAX: MSC MARIA CLARA KQ537A - Delayed by 3 days
- WALLABY: MSC SHAHAR KN539A - Delayed by 3 days
- CAT: Blank Sailing
Week 40:
- A3: OOCL KUALA LUMPUR V.184S - Delayed by 4 days
- AUN: ARIES V.538S - Delayed by 3 days
- WALLABY: Blank Sailing
Schedule Reliability:
Down south, things aren’t much smoother. A tropical storm battered Hong Kong on 8 September, creating widespread transport disruptions. And in Shenzhen, tighter Customs checks are slowing things right down, containers are being diverted for inspection, pushing delays out as far as two weeks despite efforts to fast-track compliance.
New Zealand
At Tauranga, wild winds slowed operations last week and more weather-related disruptions may roll into this week. Expect some vessels to sail off-window, influenced by yard density, labour, and equipment constraints.
Vietnam
Haiphong: Vessels are facing about 1 day of delays, with berth and yard congestion keeping utilisation at 85%. Ho Chi Minh City: Wait times are closer to 1.95 days, and Cat Lai’s yard is at a whopping 96% capacity, continuing to choke terminal efficiency.
Malaysia
At Port Kelang, vessel waits eased slightly to 1.21 days this week. But high yard density (sitting at 88%) and vessel bunching are still keeping productivity under pressure.
Japan
At Yokohama, operations are under strain as CMA shifts from terminal D4 to D5. Between the move and crane relocations, capacity will be tight for the next three weeks, with vessel waits averaging 1.5–2 days.
Indonesia
Protests over parliamentary allowances and economic pressures have escalated into violent unrest across major cities. While ports remain open, road transport is severely restricted due to safety risks and driver shortages. Forwarders are working remotely where possible, but shippers should expect documentation delays.
Due to accumulated delays from preceding ports, please be advised that CONTI ANNAPURNA 536S/539N will omit Fremantle port as a schedule recovery measure to mitigate any further delays to the service.
Source: ANL
India Subcontinent
India Subcontinent
.png)
Bangladesh
Bangladesh Port congestion remains high at Chittagong, with yard utilisation sitting at ~89%. Vessels are facing a 7-day average wait of 1.75 days. The port continues to enforce strict 48-hour limits for gearless vessels, meaning extended stays aren’t permitted if containers aren’t ready at the hook on time. Shippers should plan carefully to avoid demurrage or missed slots.
India
Mundra & Kandla: Transport unions have announced an indefinite strike starting 12th September, citing poor road conditions and inaction by the NHAI. This suspension affects all Kutch district transporters, significantly disrupting cargo movement and port operations at both Mundra and Kandla. Forwarders and importers should anticipate delays and consider alternative arrangements where possible.
Nhava Sheva: Vessels are seeing a 7-day average wait of 1 day. However, weather-related stoppages remain a possibility this week, potentially affecting schedules.
Sri Lanka
Terminal operations in Colombo are under pressure due to high yard congestion, rising transshipment volumes, and adverse weather conditions. Vessels are currently experiencing a 7-day average wait of 1.41 days, and these factors may continue to affect reliability and turnaround times over the coming week.
Summary: Across South and South Asia, port congestion, labour actions, and weather are the main challenges this week. Bangladesh is enforcing strict operational limits, while India faces major disruptions from transport strikes. Colombo continues to feel the strain from yard density and transshipment pressures. Forwarders and shippers should build in additional buffer time and monitor updates closely to mitigate delays.
Upcoming Public Holidays
- JAPAN: Autumnal Equinox Day (Mid Autumn Festival): 30 September
- Culture Day: 3rd November
- CHINA: National Day of the People's Republic of China (Golden Week): 1st October - 8th October.
- SINGAPORE: Deepavali: 12th November
- MALAYSIA: Deepavali: 12th November
North America
North America

Ocean rates
Carriers kicked off September with a hefty GRI of $800–$900 per FEU, and the trend is far from cooling. Spot rates from Asia to the U.S. West Coast surged over 20% in just a week, with additional hikes already locked in for mid-September and again on October 1. Depending on the carrier, those increases could range anywhere from $1,000 to $3,000 per 40-foot box. Importers should expect a volatile pricing environment with carriers testing just how much the market will bear.
Capacity
With many shippers moving cargo early to get ahead of possible tariffs, the usual summer push never really materialised, leaving the run-up to Golden Week 2025 quieter than expected. Demand has stayed flat, and instead of a volume surge, carriers are now contending with too much space on the water. To steady the imbalance, some lines are pulling capacity, with Premier Alliance pausing its PS5 service as part of planned blank sailings.
Despite softer demand and a 20% slide in bookings over the past six weeks, carriers are keeping the market tight. The playbook is familiar: blank sailings and restricted allocations designed to create artificial scarcity. Looking ahead, October will bring even more cuts, particularly around China’s Golden Week, as alliances continue to pull capacity eastbound into the U.S. market. The strategy is clear, llimit supply to hold rates firm, even as tariffs and muted consumer demand weigh on volumes.
Schedule Reliability
Reliability remains under pressure. Several Chinese ports are already facing five-plus day delays, with hotspots like Huangpu and Wuhan seeing around six days and Qinzhou stretching to nearly eleven. Meanwhile, Shanghai, Ningbo, and Qingdao continue to struggle with vessels queued offshore. With Golden Week disruptions looming, shippers should brace for further congestion, missed sailings, and longer lead times.
Europe
Europe
.png)
Ocean freight rates
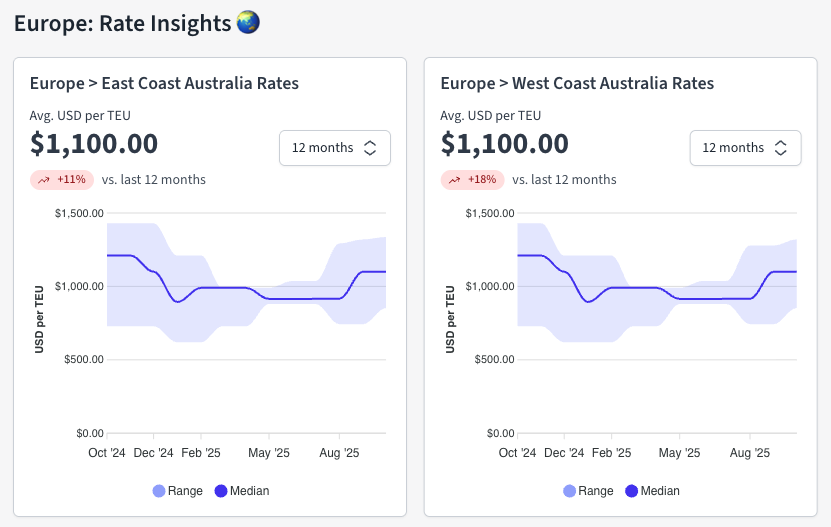
FEWB: Freight rates continue to lose ground, with the SCFI sliding another $166/TEU in Week 37. The FAK market isn’t showing signs of relief either, with another dip expected before month’s end as demand stays sluggish. Looking ahead, Q4 contract discussions have kicked off. Carriers remain reluctant to drop long-term offers below current spot levels, but many are signalling that Peak Season Surcharges could ease, or disappear altogether, as the year winds down.
TAWB: Spot rates on the North Europe–U.S. East Coast trade are holding around $1,900/FEU as of early September, down roughly 5% since June.
Capacity and schedule reliability

Capacity
On the FEWB trade, the second half of September reflects that space is wide open with carriers actively chasing extra cargo to fill their vessels. Demand has fallen off sharply, and with no meaningful rebound expected before Golden Week, the market is running soft.
For TAWB, equipment shortages linger across parts of Central and Eastern Europe, creating challenges for exporters at origin, though overall vessel capacity remains stead
Schedule reliability
Northern European ports continue to experience congestion and operational pressures, with yard density, labour shortages, and ongoing maintenance affecting schedules across the region.
Belgium Operations remain tight across both Q913 and Q869. Yard utilisation is moderate to high (65–75%), with reefers around 65%. Truck turnarounds are averaging 45–55 minutes. While night pickups are available, uptake is still low. All cranes are operational, although ongoing asphalting works and underperformance at Q869 have prompted PSA to request higher cargo volumes.
France Strike action has disrupted the French network, with walkouts scheduled for 10 and 18 September. At Le Havre, vessels face average delays of three days, and some are waiting up to four. Yard density at CNMP LH sits at 40%, with Crane 700 now repaired. Labour availability is expected to normalise following the holiday period, offering some relief in the coming weeks.
Germany Ports in Germany are operating at high capacity. Hamburg is particularly affected, with truck turnarounds delayed due to limited timeslot availability, and rail transport constrained as trains await entry approvals. Hinterland productivity is further limited by ongoing infrastructure projects. Compounding these challenges, the customs office at HHLA Container Terminal Altenwerder is temporarily closed until the end of September, shifting all processing to Hamburg Customs.
- Bremerhaven continues to see relatively modest delays, with a 7-day average vessel wait of about one day, though yard utilisation remains high (80–85%).
- Hamburg vessels are experiencing average delays of 2.3 days. EUROGATE will close temporarily on 16 September for a staff assembly, and CTB, CTA, and CTH terminals are all experiencing high yard density and operational bottlenecks, including crane breakdowns, construction projects, and limited berth capacity.
Italy Vessels face an average wait of 1.2 days, but congestion remains high, with yard utilisation at 77%. Labour shortages continue to impact operations, and some carriers are beginning to omit the port altogether to maintain schedule integrity.
Netherlands Vessel scheduling continues to be challenged by yard density and operational interruptions.
- MVII (Maasvlakte II) will undergo a 12-hour IT outage from 10–11 September, halting terminal operations. Yard density remains high at 89%, with reefer plug availability tight. Tug shortages and wind delays caused minor disruption, though schedules remain largely intact.
ECT is experiencing barge and feeder delays of up to 24 hours, with inter-terminal transfers still restricted.
RWG faces yard utilisation at 80%, with berth waiting times averaging five days due to heavy import and empty volumes.
United Kingdom
London Gateway is grappling with severe rail congestion, with draft restrictions at Berth 4 (max 15.1m) requiring careful planning for larger vessels.
Southampton is also under pressure, with vessel waits averaging 1.8 days and yard utilisation at 91% for dry cargo and 57% for reefers. Congestion is compounded by late arrivals, diverted cargo, limited gang availability, pilot station closures, and adverse weather earlier in the month.
Summary: Across Europe, port congestion, high yard density, and labour shortages remain the dominant themes. Northern ports are particularly impacted by strikes, maintenance works, and customs office closures, while Southern and Western Europe face high utilisation and operational bottlenecks. Forwarders and importers should plan for longer vessel waits, increased dwell times, and reduced flexibility in scheduling, particularly over the next few weeks.
Global air freight
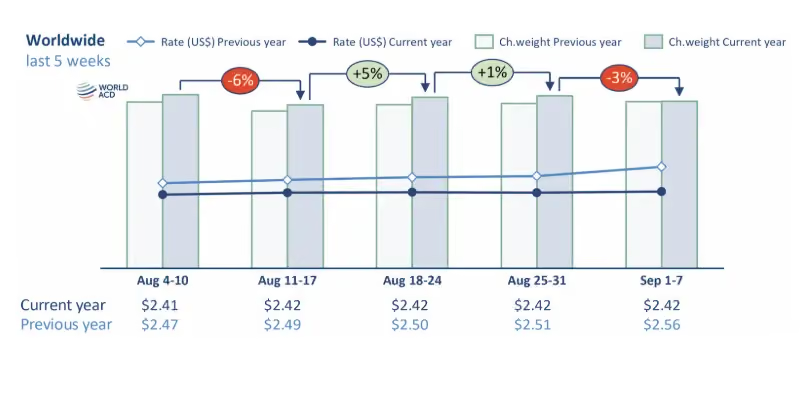
The new 50% U.S. tariff on Indian imports has already reshaped trade flows. Ahead of the increase, exporters rushed cargo out under the lower 25% rate. But once the higher tariff took effect, U.S.-bound volumes from India sank, dropping about 12% in week 35 and another 14% in week 36.
In contrast, India’s exports to Europe continue to build momentum, and Sri Lanka has posted strong gains into the U.S., with double-digit year-on-year growth.
Airfreight prices on India–USA lanes have slipped below $4/kg for the first time in months, landing at $3.99/kg in week 36. That’s about 22% lower than last year, reflecting weaker demand post-tariff.
Global volumes eased by around 3% week-over-week, with nearly half of that decline tied to North American flows. The U.S. Labor Day holiday and Typhoon Tapah in East Asia both disrupted schedules, cutting uplift in key hubs.
Trade flow shifts
- China & Hong Kong → USA: trending down 5–10% year-on-year.
- South Korea → USA: deeper slide, consistently 20–30% lower.
- Vietnam, Thailand, Taiwan → USA: strong growth, up around 40% year-on-year in recent weeks.
At the same time, China/Hong Kong → Europe volumes are climbing, suggesting some realignment of supply chains.
Adding another layer of complexity, the U.S. has now suspended duty-free de minimis exemptions on commercial imports, which could re-shape small-parcel airfreight patterns in the weeks ahead.
Expect continued weakness on India–USA pricing as the market adjusts to the tariff shock. Growth from Southeast Asian origins will likely remain a defining trend as shippers diversify away from China. With regulatory changes and weather disruptions in play, volatility in rates and capacity is set to persist.
Source: World ACD
Global shipping overview
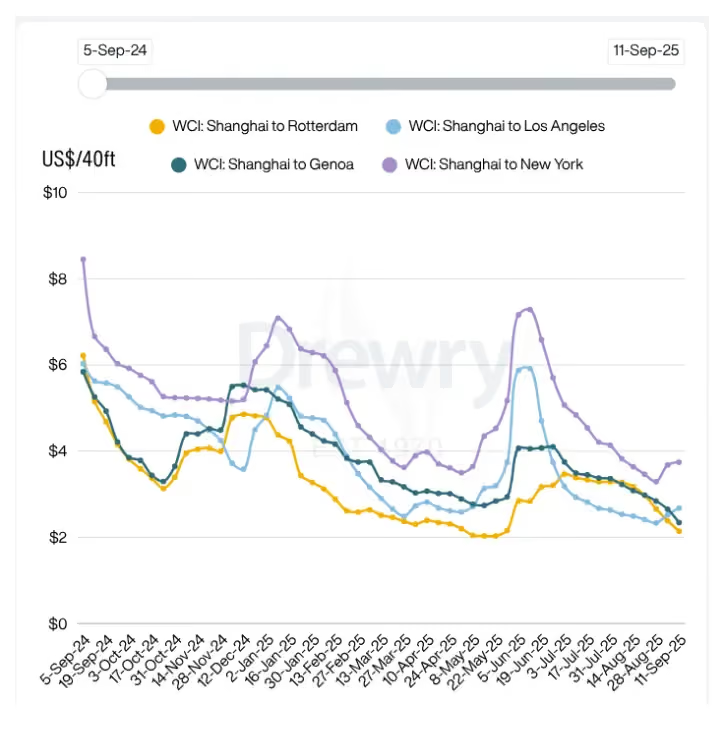
US (Transpacific) Transpacific spot rates showed an upward trend this week following GRI announcements by several carriers. Shanghai to Los Angeles increased 6% to $2,678 per 40ft, while Shanghai to New York rose 2% to $3,743 per 40ft. Despite the approaching Golden Week holidays in China, rates are expected to remain relatively stable, provided no significant changes in capacity occur.
EU (Asia–Europe) Asia–Europe spot rates declined this week, with Shanghai–Rotterdam falling 10% to $2,143 per 40ft and Shanghai–Genoa down 12% to $2,342 per 40ft. The decrease reflects increased vessel capacity entering the trade alongside softer demand. With blank sailings scheduled ahead of China’s Golden Week (starting 1 October), a slight further decline in rates is anticipated.
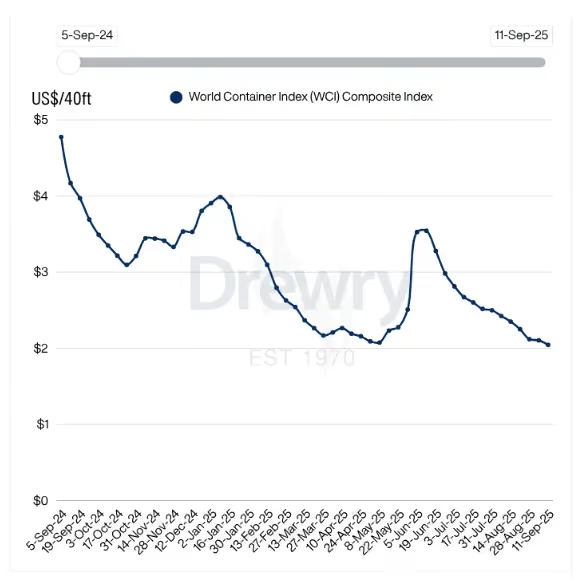
Outlook Drewry forecasts the supply-demand balance to weaken in the second half of 2025, leading to continued pressure on spot rates. Market volatility will be influenced by potential US tariffs and penalties on Chinese vessels, though timing and impact remain uncertain.
The surge in new containership orders continues unabated. In the first nine months of 2025, 385 units totaling 3.36 million TEU have been ordered. If the current pace persists, the annual total could match or exceed the record 4.67 million TEU ordered in 2024. The orderbook now stands at 32.2% of the existing fleet, with planned deliveries reaching 2.9 million TEU in 2027 and 3.8 million TEU in 2028. These new deliveries are projected to significantly outpace the anticipated scrapping of older vessels over the next three years.
Source: Linerlytica
Market Volatility Impacts 2025 Q2 Profitability
In Q2 2025, major shipping lines experienced a significant decline in profitability due to market volatility and shifting trade dynamics. The combined EBIT for these lines dropped to USD 2.73 billion, marking a decrease from Q1 2025 and positioning Q2 2025 as one of the less profitable periods since 2020.
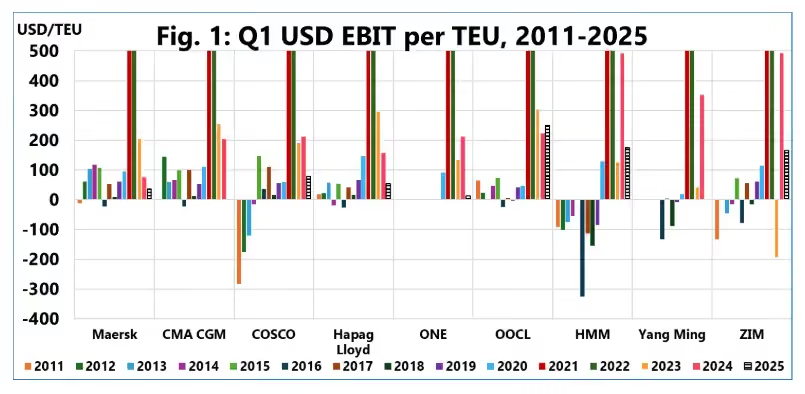
Key Highlights:
- Transpacific vs. Asia-Europe Trade: The Transpacific trade faced widespread volume contractions, while the Asia-Europe trade saw strong volume growth, with three out of six shipping lines reporting double-digit year-over-year increases.
- EBIT per TEU: Despite the downturn, all major shipping lines reported positive EBIT per TEU. Notably, OOCL led with USD 249 per TEU, followed by HMM at USD 176 and ZIM at USD 167. Conversely, Maersk, Hapag-Lloyd, and COSCO reported EBIT per TEU below USD 100.
- Operational Performance: The divergence in operational performance between the Transpacific and Asia-Europe markets directly translated into a strong market share shift between the two San Pedro Bay ports. The Port of Los Angeles was the only West Coast port to grow its share in Q2 2025, capturing an additional 2.8 percentage points of the laden import market, primarily at the expense of the Port of Long Beach.
Conclusion: The Q2 2025 results underscore the challenges faced by shipping lines amid market volatility and shifting trade patterns. While profitability remains positive, the industry is navigating a more complex and competitive landscape.
Source: Sea Intelligence
General news
Nearly 70 cargo containers toppled off the vessel Mississippi while berthed at the Port of Long Beach, spilling general cargo such as clothes, furniture, shoes, and electronics. No injuries were reported, but a clean-air barge alongside the ship was damaged and port operations were briefly halted before resuming the next day. The U.S. Coast Guard, along with local police and fire departments, has launched an investigation into the cause. While the incident was contained quickly, it highlights ongoing risks to safety, equipment integrity, and supply chain reliability at one of the busiest gateways for U.S. trade.
Source: LA Times
A freight handler in his 40s died at Sydney’s Kingsford Smith Airport on the morning of 7 September after being struck by heavy machinery in the Qantas international freight terminal. Emergency services responded around 10:30 AM, but after being crushed in the accident, the man could not be revived. NSW Police set up a crime scene, though the death is not being treated as suspicious. SafeWork NSW is involved, and support has been offered to colleagues and staff. Passenger operations were unaffected.
Source: News.com.au
Interesting Articles
- How Three Global Crises Are Reshaping World Shipping
- Retailers see import decline through end of 2025
- Australia To Invest $8 Billion In Nuclear Submarine Shipyard
- How tariff wars are reshaping migration and raising the risk of human rights abuses in supply chains
- Global Logistics Surge: International Freight Forwarding Market Set to Surpass USD 167.2 Billion by 2032
- Custom Shipment Tasks: Smarter Workflows for Supply Chain Visibility
.avif)
Experienced Business Development Manager with a demonstrated history of working in the logistics and supply chain industry. Skilled in Import/Export, Freight Transportation, Freight, Warehouse Operations, and Overseas Networking.
Frequently Asked Questions
Explorate gives supply chain managers one real-time view across ever forwarder, lane and mode without replacing your current process, partners or systems.

