
.avif)
What's happening in global freight
The market is caught between weak global demand and aggressive capacity cuts. Typhoons have created major backlogs in South China, Golden Week is forcing a booking freeze, and carriers are preparing steep price hikes for mid-October.
Bottom line: The next 6-8 weeks will be challenging, testing the agility of APAC shippers.
North East Asia
North East Asia

China’s Golden Week holiday will run from Wednesday, October 1, to Wednesday, October 8. This year’s break is extended to eight days as National Day coincides with the Mid-Autumn Festival, driving one of the busiest travel and holiday periods of the year.
What to Expect During Golden Week
- Mass Travel: Hundreds of millions of people travel across China, creating extreme pressure on road, rail, and air networks.
- Congested Hotspots: Tourist and commercial hubs experience heavy crowding.
- Price Surges: Airlines, hotels, and transport services typically raise prices due to strong seasonal demand.
- Festivities: Parades, fireworks, and cultural events will take place nationwide.
Logistics & Supply Chain Impact
- Port & Airport Operations: Vessel and flight schedules often face congestion and delays both leading up to and following the holiday, with reduced staffing during the break.
- Trucking & Warehousing: Domestic trucking services and warehouses will run at limited capacity, with many facilities closing entirely.
- Customs Clearance: Customs offices will be closed October 1–8, leading to clearance delays and backlogs once operations resume.
- Booking Pressure: Space on vessels and flights will be extremely tight ahead of the holiday, with demand surging again immediately after.
📌 Key Dates: October 1–8, 2025 (Wednesday–Wednesday)
📌 Key Factor: Overlap of National Day & Mid-Autumn Festival
Takeaway: Importers and exporters should expect delays, congestion, and higher costs around this period. Advance planning, early bookings, and buffer time in supply chain schedules are essential to minimize disruption.
Market Outlook
The first half of October is essentially an extension of late September trends. With Golden Week (Oct 1–8) overlapping Mid-Autumn Festival, new bookings are only being accepted for vessels with ETDs after 11–12 October.
What’s happening:
- Pre-holiday rush, filled vessels: Sailings during Oct 1–8 are already packed with late-September cargo.
- Extended free time & overbooking: Carriers allowed longer port free time to get containers returned before the break, then heavily overbooked to ensure full loads.
- Rates on hold until Oct 14: Carriers rolled late-September rates forward, with only slight adjustments from budget and premium providers.
- Blank sailings ahead: With extra capacity pulled and blank sailings scheduled, lines are preparing for rate hikes mid-October.
Looking ahead:
- From Oct 15: Expect significant GRIs on the China–Australia lane (USD +500 per TEU). China–NZ will feel knock-on effects, though more muted given overcapacity.
- Space pressure: Post-holiday demand plus blank sailings will create a tight market through mid-November, traditionally the busiest 30 days of the year on this trade.
South China Pressure Points (Shenzhen & Guangzhou):
Trucking in South China has become particularly challenging due to:
- Typhoon Ragasa disruptions – recent terminal closures created significant backlogs, with containers queuing to load.
- Pre-holiday cargo rush – factories rushing to move cargo before Golden Week, adding strain.
- Driver shortages – some drivers on leave, others stuck in long queues at terminals; what used to be a 1-day turnaround is now stretching to ~3 days.
Looking Ahead:
- Conditions may ease slightly post-typhoon, but factory closures for Golden Week will limit cargo movements until after the holiday.
- With blank sailings mid-October and rolled containers from pre-holiday sailings, space is expected to tighten in late October.
- Importers should anticipate upward pressure on freight rates in 2H October.
Ocean freight rates

- Most Competitive Services Budget carriers have pushed rates down to USD 1100-1200 per TEU ex base ports (Shenzhen/Nansha/Ningbo/Shanghai). Qingdao pricing is slightly higher at USD 12000 – 1,250 per TEU due to stronger local demand. This is a clear rate war to capture market share ahead of the holiday.
- Mid-Tier Services NEAX carriers and alliances like AUN are holding around USD 1150-1200 per TEU ex base ports and USD 1200-1300 per TEU ex Qingdao/Tianjin. These lines are heavily overbooking to build a strong roll pool through Golden Week.
- Premium Services The A3 consortium adjusted rates down slightly but remains above the market average. Their current levels are USD 1400-1450 per TEU. Demand remains high for these services, and no further reductions are expected for now.
- Australia West Coast Congestion at Singapore transshipment remains an issue, with rates currently ranging USD 1150–1200 per TEU depending on the carrier.
📌 Market Outlook: Pre-Golden Week promotions and extra-loader deployments have created a short-term buyer’s market. Rates remain under pressure through early October, but with extensive blank sailings planned and the seasonal cargo rush resuming post-holiday, substantial increases are expected from mid-October onward.
Advertised GRIs/PSS
- ANL: USD300.00 per TEU GRI for all cargo from North East Asia, South East Asia, Indian Sub-Continent & Middle East to Australia and New Zealand. Effective from the 15th October.
- MSC: USD300.00 per TEU GRI for all cargo from China, Hong Kong, Taiwan, Japan, Korea, Cambodia, Thailand, Vietnam, Malaysia, Myanmar, Singapore, Philippines, and Indonesia to Australia and New Zealand. Effective from the 15th October.
- OOCL: USD300.00 per TEU GRI for all cargo from North East Asia to Australia/NZ. Effective from the 15th October. Southeast Asia Rates
Capacity and schedule reliability

South East Asia
South East Asia
.avif)
Rates vary between USD1000-1300 per TEU for the majority of ports into both the East & West Coasts of Australia.
Ocean freight rates

Capacity and schedule reliability

Capacity
Additional Loaders:
- PIL: TS BANGKOK 2516S / 1787 TEU. SHK 22/Oct →HKG 23/Oct→NSA 24/Oct→BNE 5/Nov→SYD 8/Nov→MEL11/Nov
- ANL: CMA CGM SEMARANG / 2700 TEU. TAO 27/Oct→SHA 29/Oct→SHK 2/Nov→SYD 15/Nov →MEL 18/Nov
Blank Sailings/Delays
Week 41:
- A3: OOCL KUALA LUMPUR V.184S - delayed by 8 days
- NEAX: WIDE JULIET V.0115S - advanced by 6 days
- PANDA/ZAX: Blank Sailing
- WALLABY: MSC NASSAU IV KN541A - delayed by 2 days
- CAT: TIAN SHUN HE V.2506s - delayed by 2 days
- CA2: KOTA LIHAT V.0217s - delayed by 5 days
Week 42:
- CAT: Blank Sailing
- DRAGON: Blank Sailing
- CA2: KOTA LAWA V.0099s - delayed by 5 days
Week 43:
- WALLABY: Slide 1 week
Week 49:
- CAT: Blank Sailing
Schedule Reliability:
South China Super Typhoon Ragasa brought operations to a standstill across key terminals - Yantian, Shekou, Nansha, and Hong Kong - with gate and rail services suspended between 22 and 25 September. While activity officially resumed on the 25th, backlogs are still unwinding with delays averaging 4–5 days. Adding to the weather chaos, Tropical Cyclone Bualoi intensified on 25 September and is tracking towards the Philippines, Vietnam, Laos, and China, with potential for further disruption this week.
Vietnam Congestion continues to weigh heavily on Vietnam’s major gateways. At Haiphong, vessel waiting times are hovering at 1 day, with yard utilisation pushing 80%. Meanwhile, Ho Chi Minh City is facing even tighter pressure, with average waits stretching beyond 2 days and Cat Lai’s yard running at 90% utilisation.
Malaysia At Port Klang, berth congestion and vessel bunching have pushed average waiting times to just over 1 day. Yard density sits at 85%, restricting overall productivity and slowing container movements.
New Zealand High winds knocked out 57 hours of operations at Tauranga’s TCT last week, with intermittent weather impacts continuing into mid-September. While services have resumed, the stop-start conditions are straining schedule reliability.
India Subcontinent
India Subcontinent
.png)
Sri Lanka Colombo is under pressure, with terminal operations slowed by heavy yard congestion, rising transhipment volumes, and ongoing weather disruptions. Productivity remains constrained across key terminals.
Bangladesh
Chittagong: Average vessel waiting times are currently around 1.35 days. Berthing congestion has eased slightly, but delays of 1–3 days persist. Yard occupancy is running high at 85%, with equipment breakdowns and wider logistical challenges hampering smooth operations.
Dhaka ICD: Inland congestion is acute, with dwelling times exceeding 20 days due to locomotive shortages. Overweight containers face even longer delays of more than 30 days, while train departures remain restricted, adding to the inland supply chain strain.
Upcoming Public Holidays
- AUSTRALIA: Labour Day: 6th October (ACT, NSW, SA), King’s Birthday: 6th October (QLD)
- SINGAPORE: Deepavali: 12th November
- MALAYSIA: Deepavali: 12th November
North America
North America

Rates
TPEB: Peak Season Surcharge (PSS): Deferred until Oct 15 - no surcharge applied pre-Golden Week. The Sept 15 GRI has been fully withdrawn. Carriers are lowering rates to stimulate demand, with many extending September levels through Oct 14.
Capacity
Importers pulling shipments forward ahead of potential tariffs created a softer-than-expected peak season. The result: oversupply in the market, weaker demand, and a quiet lead-up to Golden Week.
Carriers are managing excess capacity with blank sailings to prevent rates from sliding further. For example, the Premier Alliance has suspended its PS5 service from China to the U.S. West Coast.
Both the East and West Coast markets remain oversupplied, with no noticeable pre-Golden Week rush. Space remains widely available, particularly to the East Coast.
Schedule Reliability
Operations at the Port of Long Beach were impacted by the ZIM Mississippi container incident. Discharge resumed on Sept 17 (U.S. local time), but all containers linked to the incident remain on hold pending a U.S. Coast Guard investigation. Impacted cargo owners will be updated once the release is confirmed.
US Tariffs
Trump’s proposed 100% tariff on non-U.S. films Donald Trump has doubled down on a threat to impose a sweeping tariff on films produced outside the U.S., sparking alarm across the global screen industry.
What’s proposed
- 100% tariff on all “non-U.S.” films entering the American market.
- Justification: protecting Hollywood from foreign incentives and productions.
Industry concerns
- Defining “non-U.S. film” is near impossible in today’s global co-production model.
- Films are often treated as services, not goods—making tariffs legally shaky.
- Streaming, multinational funding, and cross-border production blur enforcement.
Global reaction
- Australia: strong concern from government and screen sector; Arts Minister pledges support.
- U.K.: film unions and bodies warn of major disruption to U.K.–U.S. collaborations.
- Critics argue the U.S. already enjoys a film trade surplus, undermining Trump’s case.
Potential consequences
- Higher costs and barriers for international films accessing U.S. markets.
- Risk of stalled co-productions, investment flows, and creative partnerships.
- Likely legal challenges under U.S. trade law and WTO rules.
- Planning uncertainty for producers, investors, and distributors worldwide.
What to watch
- Whether the U.S. Trade Representative clarifies how “non-U.S.” films would be defined.
- Industry lobbying and legal action from Hollywood and international partners.
- Potential WTO disputes or retaliation from trading partners.
👉 For the full update, read our blog: U.S. Tariffs and Policy Changes: What They Mean for Global Supply Chains
Europe
Europe
.png)
Ocean freight rates

FEWB: The Sept 15 GRI was fully withdrawn due to lack of demand. Carriers have responded by lowering rates to capture bookings, with many extending current levels through Oct 14.
TAWB: Spot rates from North Europe → U.S. East Coast are averaging USD 1,838–1,911 per 40’ (mid-September, Xeneta). This represents a ~5% decline since June and a ~25% drop compared to January 2025.
Capacity and schedule reliability

Capacity
- FEWB: Around 25% of capacity will be blanked in Weeks 40–41, though this is a smaller withdrawal than in previous years, meaning overall supply remains adequate through late September into early October.
- Congestion at European ports has eased, but demand remains weak as retailers continue to manage high inventory levels and exercise caution due to inflationary pressures.
- TAWB: Equipment shortages remain an issue in inland and regional markets - particularly Austria, Slovakia, Hungary, Southern/Eastern Germany, and Portugal.
Schedule reliability
- FEWB: Service disruptions are limited, and with congestion easing, reliability is relatively stable compared to earlier in the year.
- Spain Valencia continues to feel the pinch from vessel bunching, with average waits close to 3 days. Yard density sits high at 80% with mild gate congestion.
- Italy National protests on 22 September disrupted port access across the country. Gioia Tauro is reporting 3-day vessel waits, while La Spezia is averaging 2.5 days with yard density at 77% but still manageable.
- France Labour unions have announced a 24-hour strike on 2 October, expected to cause disruption nationwide. Fos-sur-Mer currently has average vessel waits of around 2 days.
- United Kingdom London Gateway remains relatively balanced - yard utilisation at 60% for dry and 50% for reefers. High winds earlier this week forced pilot station closures, but vessel ops continued. Berth 4 remains draft-restricted to 15.1m. Rail terminal performance has picked up following the resolution of RMG failures.
- Belgium Antwerp is tight, with vessel waits just over 1 day. Yard utilisation is 75–80%, reefers near 95%, and berths are full. Strong winds closed pilot stations and delayed Gemini rotations. Barge congestion triggered the opening of an additional terminal to relieve the backlog.
- Netherlands Rotterdam is averaging 1.5-day vessel waits. Yard utilisation at ECT stands at 85%. Gang availability remains limited. Barge/feeder delays stretch to 48 hours, ITT moves are restricted, and berthing is full.
- Germany Hamburg: 2-day average vessel waits, with HHLA terminals impacted by staff assemblies and strong winds. CTA productivity was reduced by an IT failure early in the week (now resolved), but construction still restricts berth capacity. CTB is congested, with waits up to 7 days despite yard density holding steady at 75%. Bremerhaven: Rail links between Bremen and Lübberstedt will be suspended 2–6 October, with diversions via Bremervörde and Cuxhaven.
- Poland Gdynia’s average vessel wait stands at 3 days.
- GreecePiraeus remains one of the worst congested ports in the region, with vessels waiting almost 5 days on average.
Global air freight
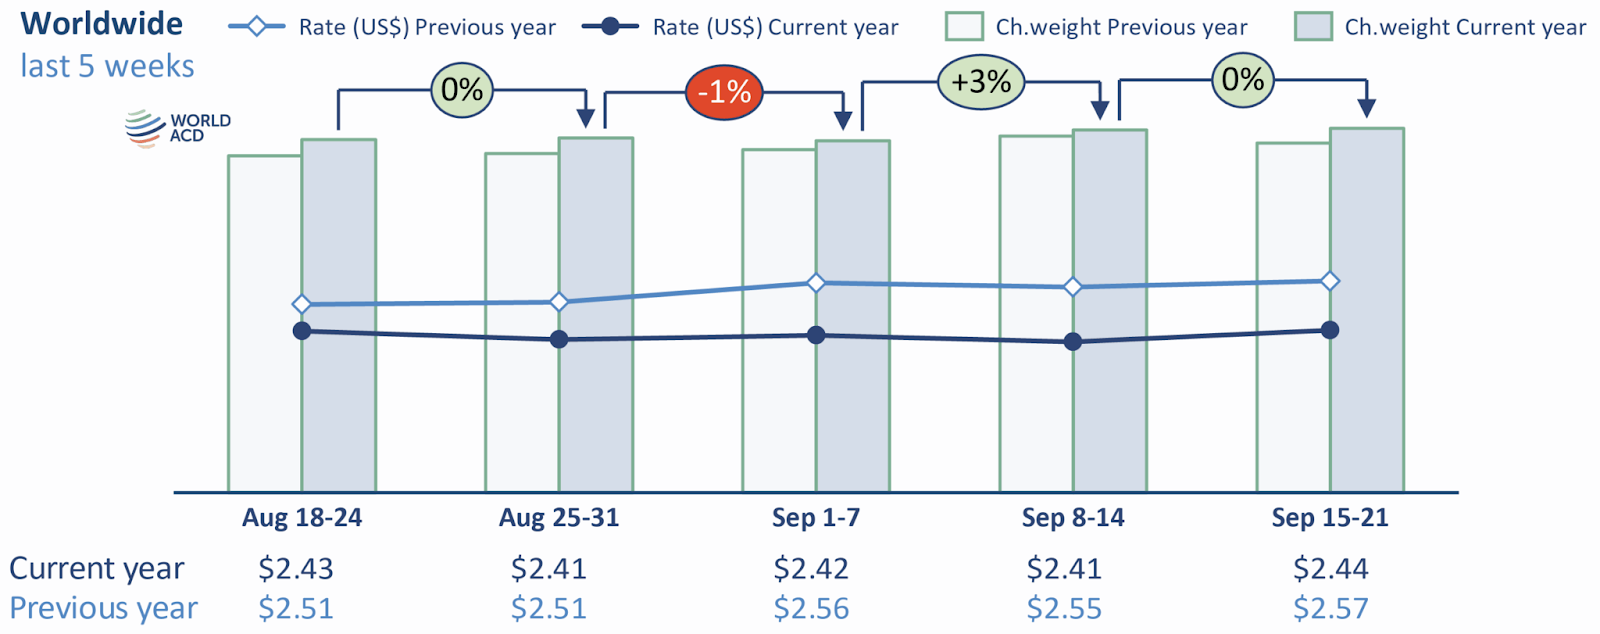
Rates and Pricing Trends Global average air cargo rates rose slightly, up around 1% week-on-week to USD 2.44/kg. While this reflects some stability in demand, rates remain ~5% below last year’s levels. The biggest pressure point continues to be the Asia–U.S. trade lane, where spot rates are nearly 20% lower year-on-year. Taiwan stands out as an exception, recording an 11% YoY increase on the back of strong semiconductor and electronics exports.
Asia–Europe Developments Volumes on the Asia–Europe corridor grew by roughly 6% YoY, showing resilience despite broader market weakness. Spot rates remain below 2024 levels across most origins, though China has turned positive again with a 3% increase in week 38 — signalling early signs of recovery ahead of the Golden Week holiday period.
Operational Disruptions The impact of Super Typhoon Ragasa continues to be felt, particularly across South and East China and Hong Kong, where flight cancellations and capacity constraints have tightened supply. With Golden Week approaching, forwarders are already reporting stronger spot rate activity out of China, pointing to further volatility in week 39.
Regional highlights
- Asia → U.S.: Demand soft, rates under pressure, except Taiwan, where tech exports are lifting prices.
- Asia → Europe: Volumes recovering, rates mixed, but China showing positive momentum.
- MESA / India → U.S.: After several weeks of tariff-driven weakness, volumes surged 12–16% WoW, showing signs of rebound in long-haul demand.
- Global Picture: Despite localized rebounds, overall sentiment remains cautious with carriers balancing capacity against uneven demand across trade lanes.
Outlook The market remains in a delicate position: global demand is steady but uneven, pricing under pressure, and seasonal disruptions (typhoon recovery + Golden Week factory closures) are likely to drive short-term volatility. Rates are expected to firm temporarily through early October as China’s export push resumes after the holiday.
Source: World ACD
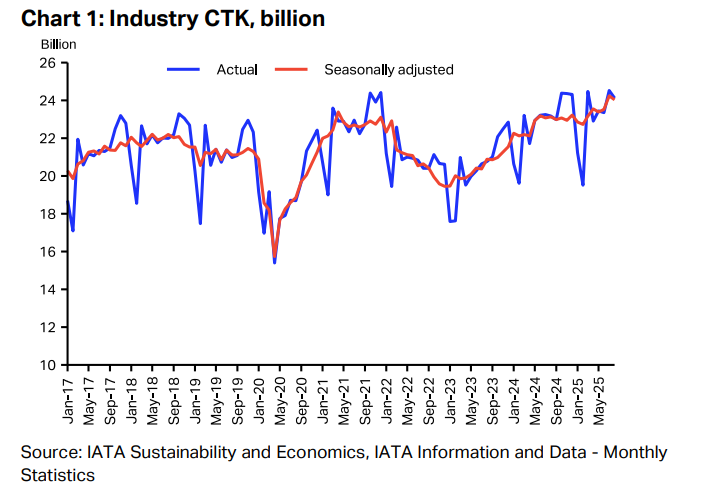
The air cargo market held up reasonably well in August, though some cracks are showing. Overall demand (measured in cargo tonne-kilometers, CTK) rose 4.1% year-on-year, down from July’s 5.5% growth. International routes saw 5.1% YoY growth, with Africa (+11%) and Asia-Pacific (~9.8%) leading the way. Capacity (available tonnage) also expanded (~3.7% YoY), so load factors ticked up only modestly. Fuel prices helped - jet fuel dropped ~6.4% YoY - but yields (freight rates per kg) continued to soften ~2.0% YoY, even with a slight month-on-month increase.
Source: IATA
Some regions are under pressure: North American carriers recorded a 2.1% drop in demand, and cargo yields are under stress globally. Belly capacity (freight on passenger aircraft) is still growing strongly, now making up over 56% of freight tonnage, while dedicated freighters are present but under more strain. Trade rerouting is also notable: high-tariff pressure has shifted some Asian exports away from North America toward Europe, Africa, and intra-Asia corridors.
What it means for Australia
- Outbound & Inbound Pressure: Australia sits as part of the Asia-Pacific network that’s driving regional growth. The strength in APAC demand helps anchor our lane flows, especially for high-value, time-sensitive cargo.
- Rate Sensitivity: With yields under pressure globally, carriers servicing Australia will need to balance pricing carefully. We may see tighter pricing margins, or promotional offers, to maintain volumes.
- Routing Shifts & Capacity Mix: As Asian exporters adjust and reroute (away from U.S. lanes), some of that volume could spill into Australia’s air networks as carriers rebalance. Also, growing belly capacity (via passenger flights) may offer upside relief against freighter constraints.
- Fuel & Cost Tailwinds: Falling jet fuel is positive for cost control, which could soften upward pressure on rates from the cost side.
- Watch for Disruptions: External shocks, typhoons, holiday closures (like Golden Week), or shifts in trade policy, can ripple into Australia’s inbound air schedules, especially for Asian-sourced cargo.

Global shipping overview
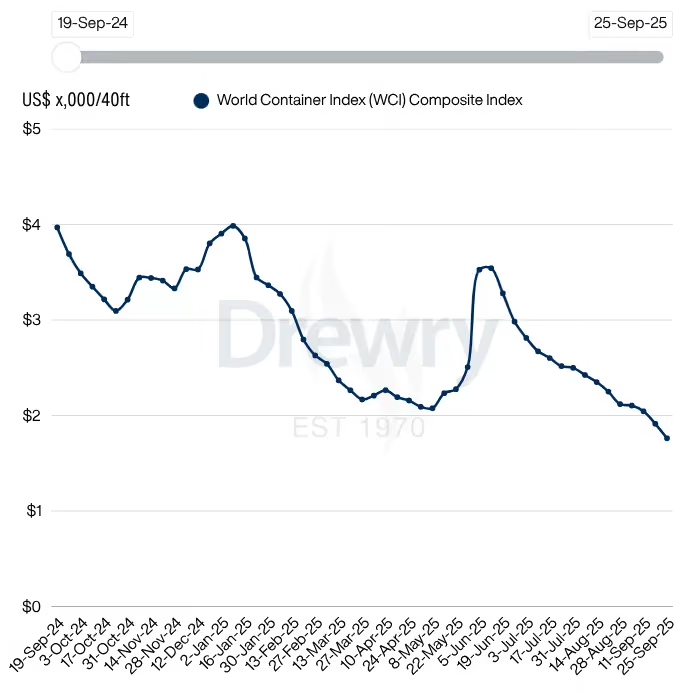
EU: The Drewry World Container Index fell by 8% this week to USD 1,761 per 40ft. On the Asia–Europe corridor, Shanghai to Rotterdam rates dropped around 9% to USD 1,735 per 40ft, while Shanghai to Genoa fell by roughly 7% to USD 1,990 per 40ft. Carriers are actively trimming capacity on these routes in an effort to counter weakening demand ahead of China’s Golden Week factory closures. Drewry forecasts that the supply-demand balance will continue to loosen over the coming quarters, which could drive further spot rate declines.
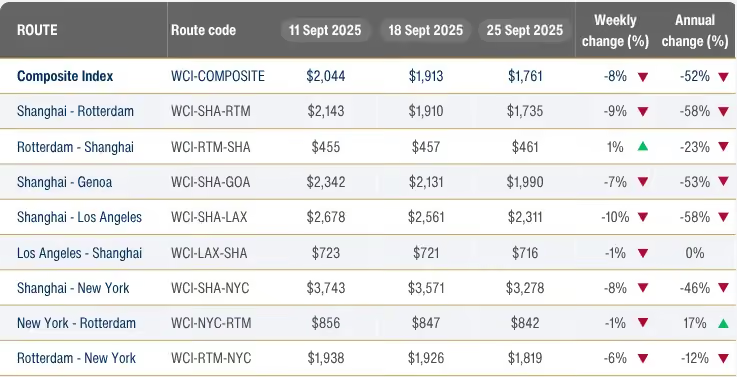
US: On the Transpacific, Shanghai to Los Angeles spot rates fell by about 10% to USD 2,311 per 40ft, while Shanghai to New York rates dropped around 8% to USD 3,278 per 40ft. These decreases follow several weeks of earlier rate gains driven by General Rate Increases and blank sailings, which have now lost momentum. Overall, the trend in US-bound rates reflects weak demand and a broader easing of upward pricing pressure across the market.

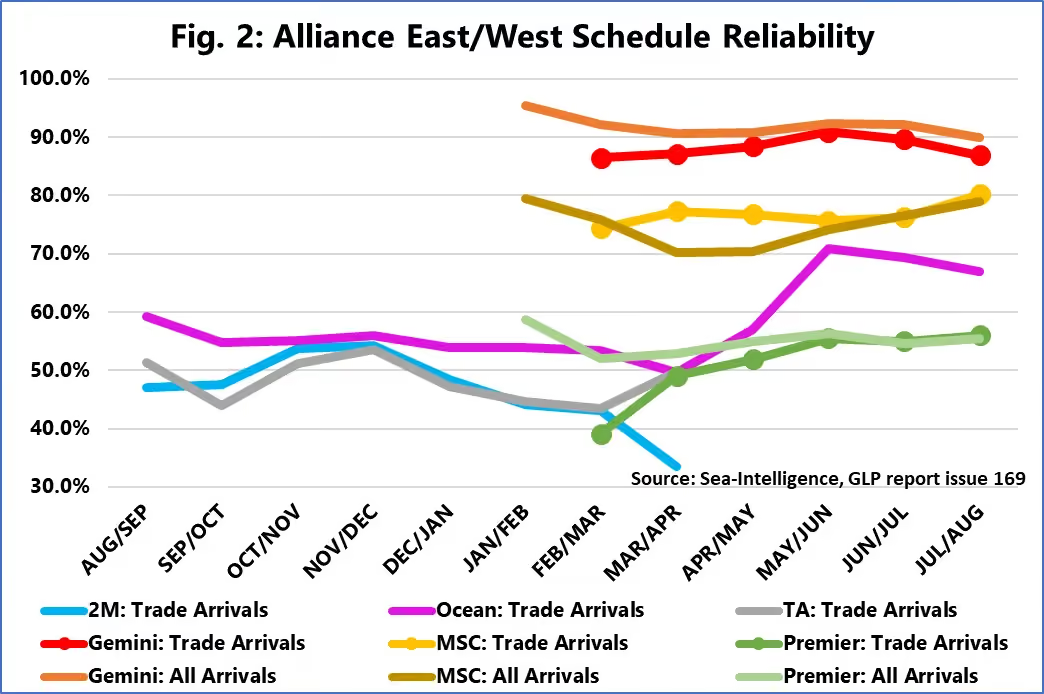
Global liner schedule reliability has stabilized in the range of 65–68 % since May 2025, with May hitting 65.8 %, the highest level since November 2023. Reliability saw a sharp month-on-month jump of +7.4 percentage points in May, and a year-on-year gain of ~10 points. Among top carriers, Maersk led with ~75.9 % reliability, followed by Hapag-Lloyd. The lowest performer among the top 13 was ONE, at ~55.1 %. Sea-Intelligence also introduced a dual-metric approach - “all arrivals” vs “trade arrivals” - to better assess performance across the newly formed alliances, which will be fully evaluated once alliance transitions are complete.
Source: Sea Intelligence

Maersk was the most reliable top-13 carrier with schedule reliability of 76.4%, followed by Hapag-Lloyd with 72.4%. The next 6 carriers were in the 60%-70% range, with the remaining carriers in the 50%-60% range. Wan Hai had the lowest August 2025 reliability of 53.3%.
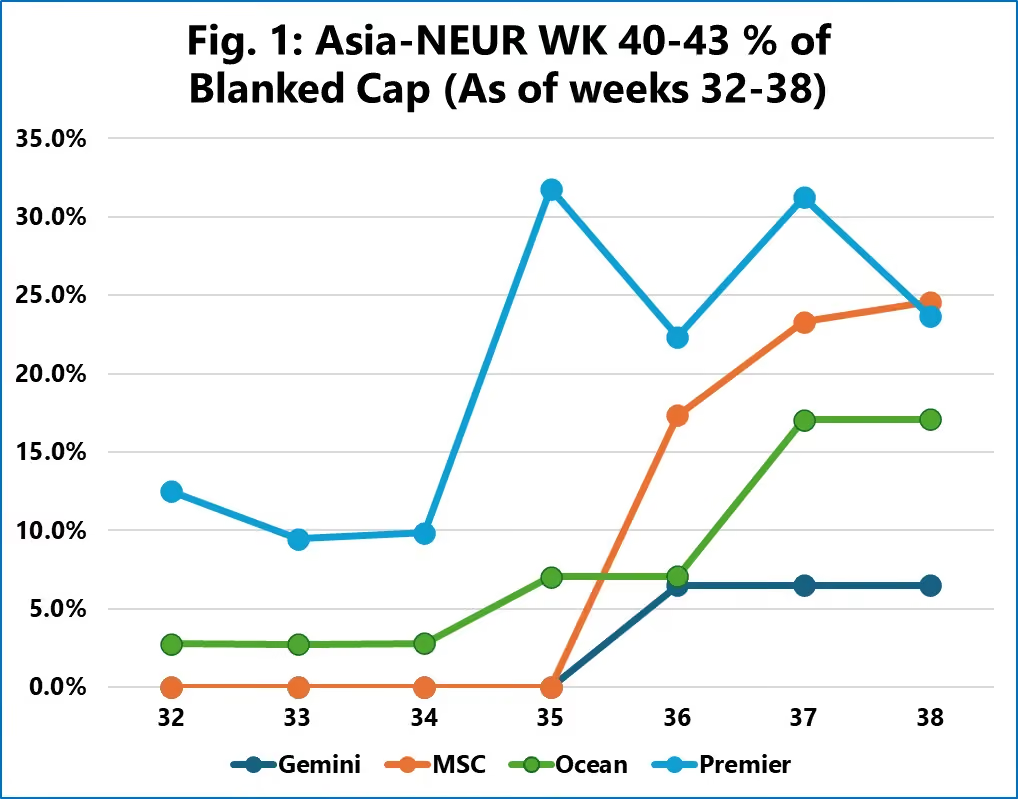
Shipping lines have sharply increased blank sailings ahead of Golden Week, withdrawing an additional ~544,000 TEU over the past four weeks across Transpacific and Asia-Europe trades. Some alliances moved early: the Premier Alliance led from week 32, with Ocean Alliance following cautiously, then accelerating in week 37. MSC and Gemini were slower to act - Gemini used a single mass withdrawal, while MSC accelerated aggressively in week 36. Despite the timing differences, the end result is that capacity reductions on these routes are now roughly in line with historical holiday levels.
Source: Sea Intelligence
General news
China has announced plans to amend its international maritime transport regulations in direct response to the USTR’s proposed port fees targeting Chinese-built vessels and carriers. The move signals a clear tit-for-tat approach, giving Beijing the authority to impose reciprocal measures against any country that enacts protectionist charges or restrictions on Chinese shipping operators. This development highlights the escalating trade tensions between the U.S. and China, with potential implications for global shipping costs and supply chain stability.
Source: The Loadstar
Typhoon Bualoi made landfall in northern central Vietnam on September 29, causing severe damage and widespread disruption. At least 13 people have died, with 17 missing. Strong winds and heavy rainfall damaged homes, roads, and bridges, while over 347,000 households lost power. Flooding inundated streets and cut off Highland communities, and four coastal airports in central Vietnam were shut down, triggering flight cancellations and delays. The storm intensified rapidly, generating waves up to 8 meters, and then weakened as it moved inland toward Laos.
Source: ABC News
Interesting Articles
.avif)
Experienced Business Development Manager with a demonstrated history of working in the logistics and supply chain industry. Skilled in Import/Export, Freight Transportation, Freight, Warehouse Operations, and Overseas Networking.
Frequently Asked Questions
Explorate gives supply chain managers one real-time view across ever forwarder, lane and mode without replacing your current process, partners or systems.

