
.avif)
Australia
Australia

We've seen several reports over the past week of high winds impacting operations in Sydney and Adelaide. As we move further into this time of year, these weather conditions are expected to become more frequent. Wharves and container parks are being affected, resulting in intermittent delays for container pickups and dehires. Current disruptions are causing waiting times of approximately 24–36 hours, largely due to temporary port closures from adverse weather and vessel bunching.
Melbourne: Melbourne is currently grappling with vessel delays of 5 to 10 days, largely due to inconsistent yard utilisation that hovers around 90% but fluctuates weekly. These capacity pressures are resulting in intermittent discharge delays.
Brisbane: Increasingly frequent delays of 3 to 7 days are being reported in Brisbane. As a key initial discharge point for many carriers, the port faces compounding challenges from heavy vessel volumes and continued yard congestion, leading to scheduling bottlenecks.
Fremantle: At Fremantle, wait times currently range from 0 to 5 days. Limited yard space continues to influence berthing availability and vessel sequencing.
North East Asia
North East Asia

Ocean freight rates
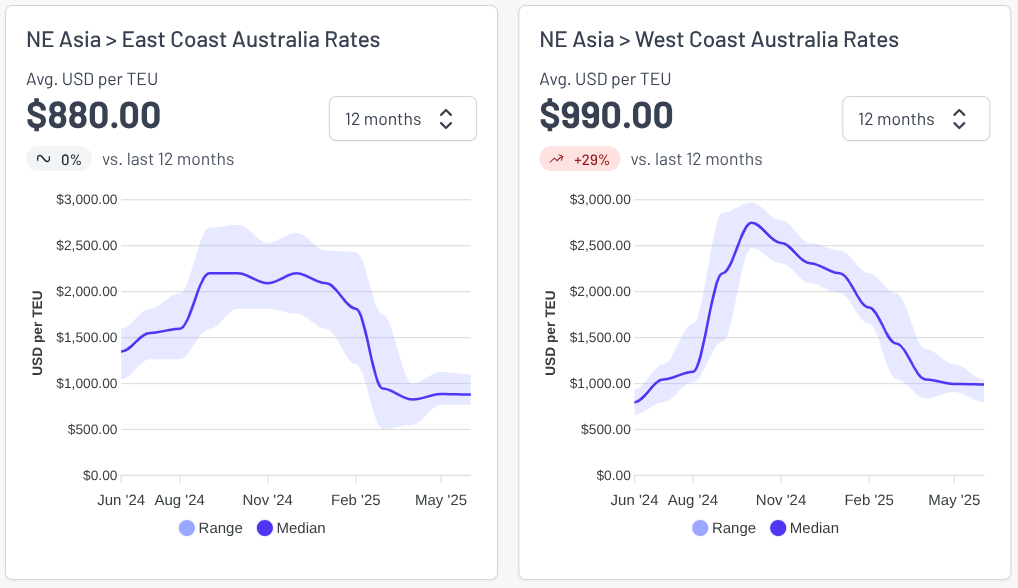
- Spot Rate Range: Spot rates are pricing tightly between USD 850 – 1100 per TEU for the first half of June 2025.
- Pricing Integration: Tariffs are currently fully common-rated, keeping the rate margins identical across both East Coast (AUEC) and West Coast (AUWC) destination gateways.
- Premium Space Baseline: Premium services (such as the A3S, A3C, A3N, JKN, and CNS alliances operated by COSCO, ANL, and OOCL) are driving a localized market premium, forcing final rate increments up by approximately 15% for the June 1–14 window.
- Budget Allocations: Budget operators running the CAT and CA2 loops are offering steadier rate baselines to secure bottom-tier volume.
Capacity and schedule reliability
Capacity
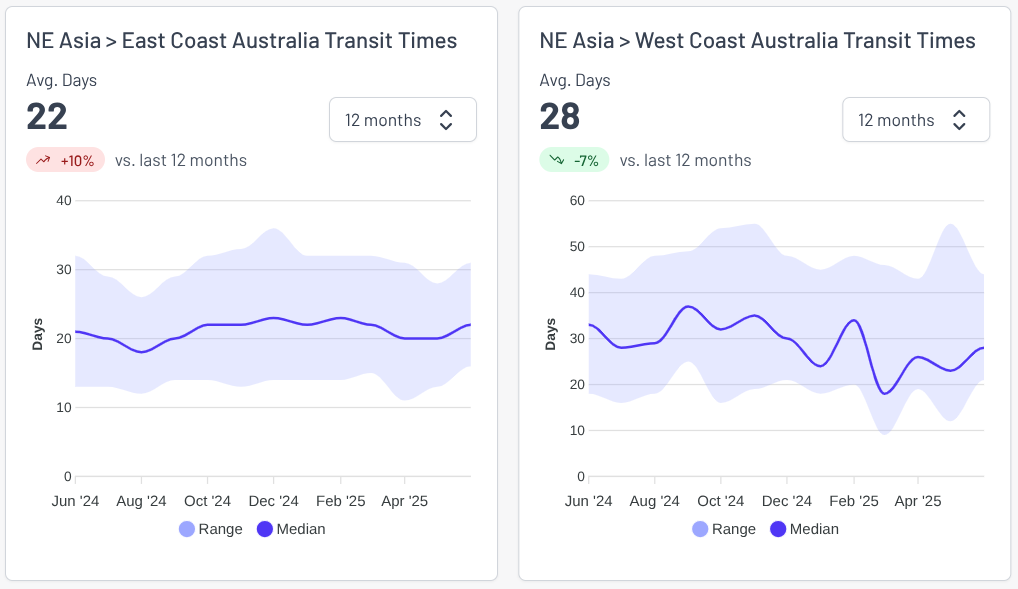
- The Tariff Redirection Effect: Following the sudden temporary suspension of U.S.-China tariffs, demand on Transpacific lanes spiked immediately. Because carriers had heavily blanked lines earlier in May, they were caught with massive capacity deficits on U.S. loops.Oceania Vessel Siphoning: To catch the higher-paying U.S. demand surge, lines aggressively pulled vessel additions away from the Australian route.ANL Extra Loader Cancellations: ANL officially withdrew two promised ad-hoc loaders from the Australian market to deploy them directly to the China–U.S. trade corridor:
- ELA 001S (1,400 TEU, including high-cube allocations)
- Qingdao Tower 001S (3,700 TEU, including high-cube allocations)
- The vessel Wide Juliet (Voyage 2337N) will completely phase out operations in Shanghai during Week 23.
- The vessel Dimitra C (Voyage 2343S) is scheduled to phase into rotation at Shanghai in Week 23 to replace Wide Juliet.
- The vessel TS Sydney (Voyage 2504S) will officially phase into the trade route line at Shanghai during Week 25.
Schedule reliability
Vessel clustering and sudden infrastructure backlogs are severely delaying turnaround times at the primary export gates:
- Shanghai (Yangshan Terminal): Experiencing vessel bunching and severe structural backlog, blowing vessel wait times out to a window of 24 to 72 hours.
- Ningbo Hub: Standard terminal berths are tracking delays of 24 to 36 hours. However, acute mega-vessel bunching at the PNIT Terminal has pushed specific delays to a peak of 72 hours.
- Qingdao Anchorage: Faced a massive spike in congestion as the local vessel queue more than doubled week-over-week, stranding 46 container ships at anchor waiting for an available slot.
- Broader China Infrastructure: Total vessel counts holding position outside the combined Shanghai–Ningbo anchorage corridors have settled at a dense footprint of 128 ships.
South East Asia
South East Asia
.avif)
Ocean freight rates
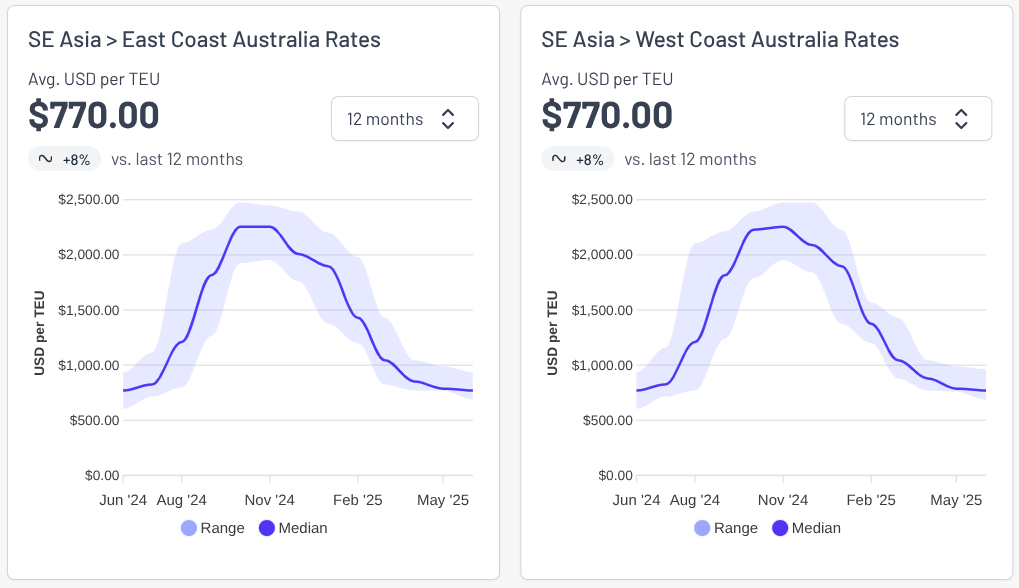
- Spot Rate Range: Aligned exactly with North Asian baselines, trading firmly between USD 850 – 1100 per TEU for immediate June loading slots.
- Peak Season GRI Pipeline: Due to rapid infrastructure degradation at local transhipment points, carriers are hitting the market with early warnings that Southeast Asia will follow suit with heavy General Rate Increases (GRIs) moving directly into the peak season.
Capacity and schedule reliability
Capacity
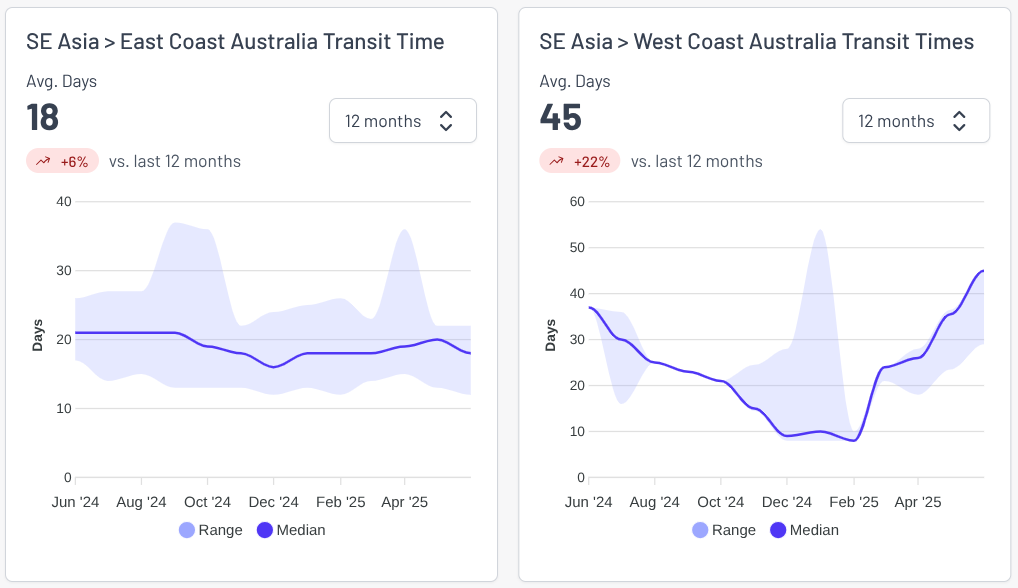
- Space Artificially Capped: While direct capacity on smaller regional loops remains intact on paper, severe yard density at international sorting hubs has created artificial booking caps. Carriers are severely limiting physical space allocations for cargo feeding down into Australia.
- MSC Booking Bans: Due to rolling capacity overflows, MSC’s WALLABY service completely stopped accepting all new cargo bookings coming out of New Zealand as of April 25, freeing up minor space margins exclusively for shipments bound for Australian destination ports (noting this service loop strictly limits its local calls to Sydney and Melbourne).
Schedule reliability
Rampant container logjams and multi-alliance vessel clustering are disrupting operational schedules across the region's main hubs:
- Singapore Anchorage: Experienced a massive wave of vessels arriving in dense clusters, causing severe terminal pile-ups. Currently, 38 ships are stuck waiting at anchor offshore, triggering extensive 1-to-2-week delays for all transhipment cargo trying to filter through the port.
- Port Klang (Malaysia): Yard utilization density has broken past the critical threshold to sit at a punishing 90% capacity ceiling. This extreme stack density has paralyzed terminal turnaround performance, driving average vessel wait times to 1.5 days, with multiple delayed vessels sitting idle for up to 2.5 days before cranes can begin handling cargo.
India Subcontinent
India Subcontinent
.png)
- Sri Lanka:
Colombo is currently facing the most severe congestion in the region. The port is overwhelmed by vessel bunching and delays, worsened by rerouted Pakistan-bound cargo. Transhipment delays now average 1–2 weeks. As of this update, 16 vessels are anchored outside the port—up from nine last week—highlighting rising operational strain. - Pakistan:
While ports in Pakistan remain operational, ongoing shipping bans and political tensions have forced many carriers to divert cargo through regional transhipment hubs like Colombo, Singapore, and Khalifa. This rerouting is contributing to rising congestion at those ports, particularly Colombo. Expect delays. - India:
Although Indian ports are functioning normally, Mundra is experiencing growing delays. Vessel waiting times have risen to over two days, and seven vessels are currently queued at anchor. The ceasefire with Pakistan has not yet lifted the shipping restrictions in place between the two nations. - Bangladesh – Chittagong (Chattogram):
Yard congestion at Chittagong stands at around 75%. Berth occupancy remains steady, with vessels typically staying for 2–3 days per call. While not as severe as elsewhere, continued congestion could impact vessel turnaround times.
North America
North America

Ocean rates
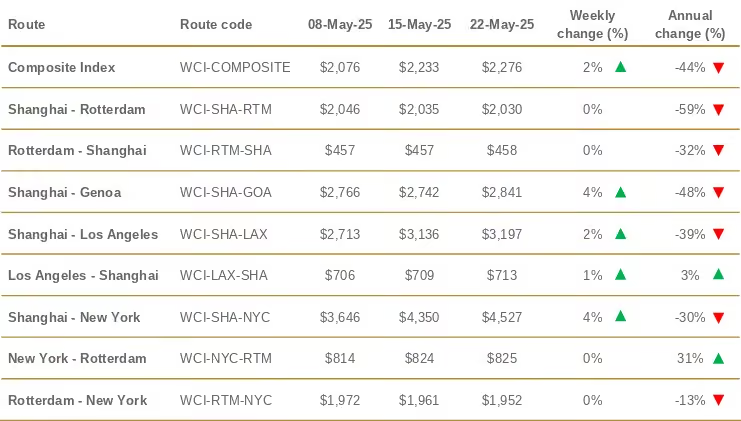
- Rates on U.S.-bound routes recorded modest gains. Freight from Shanghai to New York rose by 4%, reaching $4,527 per 40ft container. The Shanghai to Los Angeles lane increased by 2% (or $61) to $3,197, while the Los Angeles to Shanghai backhaul saw a marginal 1% rise (or $4) to $713 per container.
- With recent shifts in U.S.-China trade policies, Drewry expects spot rates to climb further in the coming week, as carriers reallocate capacity to handle increased booking volumes from China. Source: Drewry
- Freight rates on the Trans-Pacific Eastbound (TPEB) trade lane are climbing rapidly due to a combination of strong demand, tight capacity, and multiple rate hikes. Following the General Rate Increase (GRI) on May 15, carriers have announced another significant GRI of up to $3,000 per FEU effective June 1. These increases are already impacting spot market rates, especially for floating contracts. At the same time, Peak Season Surcharges (PSSs) are being introduced across fixed-rate agreements, with implementation beginning mid-May and set to rise further from June 1. The surge in booking volumes, paired with constrained space, is driving this upward pressure on pricing as the market enters an early and intense peak season.
-
Capacity
- Following a 45-day trade standstill between China and the United States, the two nations have reached a provisional 90-day tariff truce during negotiations in Geneva. This temporary agreement has triggered a surge in demand on the China–U.S. shipping corridor, as uncertainty around what will follow the 90-day window has driven both consignees and shippers to act quickly.
- Even if this arrangement transitions into a longer-term solution, the initial 45-day disruption — compounded by an average 15-day production cycle, has already resulted in a two-month operational lag. As a result, the China–U.S. lane is expected to remain under pressure for the remainder of the year.
- As of now, space allocations for late May on this route are completely booked out, and ocean freight rates have doubled in a short period. Looking ahead to June, early indicators suggest continued upward pressure, with rates possibly doubling again.
- This dramatic increase in demand has begun spilling over into adjacent trade lanes — particularly China to South America — where capacity is also extremely tight and rates have surged. In parallel, other key corridors such as China–Europe, China–Middle East, and China–Southeast Asia are all experiencing rate hikes of varying intensity.
- Carriers have responded swiftly to a surge in transpacific demand by reinstating capacity, anticipating a short-term boost in shipments following recent tariff reprieves. Despite this proactive approach, spot freight rates have only seen modest increases, lacking the significant spikes observed during previous general rate increases. Estimates suggest that between 180,000 and 540,000 TEU of cargo has accumulated in China, awaiting shipment to the U.S., reflecting the market's uncertainty about the longevity of the demand uptick and the effectiveness of carriers' capacity adjustments. Source: The Loadstar
Schedule Reliability
Liner carriers that had paused certain services are expected to restore regular service loops over the coming weeks.
✅ Resuming Week 22
Ocean Alliance
PRX / CP1 / PCS1 / PRX / AAS2
CPS / AAC2 / HBB / PCN3
ZIM
ZX2
✅ Resuming Week 23
Mediterranean Shipping Company
ORIENT
Premier Alliance
PS5
✅ Resuming Week 24
Ocean Alliance
CBX / ECC3 / AWE7 / CBX
MSC / ZIM
EMPIRE / ZNS
🚫 Suspended Until Further Notice
Premier Alliance
PN4 (Originally scheduled to launch in May)
MSC / ZIM
PELICAN / ZSL (Suspension began Week 19)
⏳ Fixed Suspension Period
Ocean Alliance
SEA3 / PSX (Suspended Week 18–23)
US Tariffs
Key updates (as at 28 May 2025):
👉 Read the full update in our Dedicated Tariffs Blog.
Europe
Europe
.png)
Ocean freight rates
- Freight rates on European trade lanes remained relatively stable. The Shanghai to Genoa route saw a 4% increase, bringing the rate to $2,841 per 40ft container. In contrast, rates from Shanghai to Rotterdam, Rotterdam to Shanghai, Rotterdam to New York, and New York to Rotterdam showed no significant movement, reflecting steady demand and capacity levels across these corridors. Source: Drewry
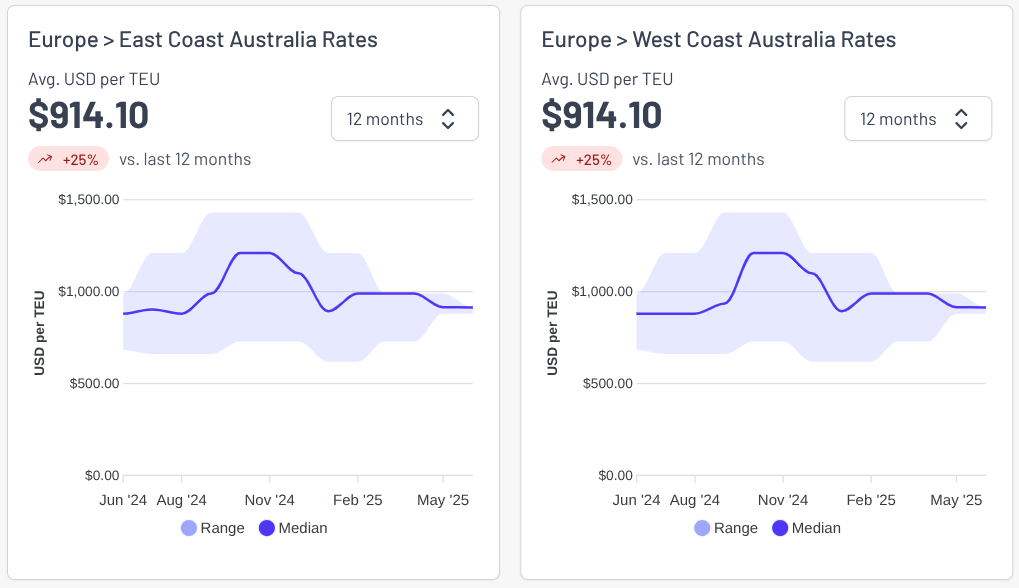
- MSC Mediterranean Shipping Company will apply a Peak Season Surcharge (PSS) to all cargo from Europe (including NWC, SCANBALTIC, West MED, East MED, Adriatic, Greece, and Turkey) POLs to Australia and New Zealand PODs, as from 15 June 2025
- The PSS will be charged at USD175.00 per TEU.
- ANL/CMA CGM Group will apply a PSS to all cargo on the NEMO and PAD services ex North Europe to Australia and New Zealand.
- The PSS will be effective from the 15th June at a level of USD300.00 per TEU.
- FEWB: Ocean carriers are implementing significant rate increases on the Asia–Europe trade lane, despite an oversupply of capacity and subdued demand. General Rate Increases (GRIs) of over 20% have been announced, with some carriers planning further hikes effective June 1. These increases are driven by factors such as port congestion in Northern Europe, ongoing disruptions in the Red Sea, and a surge in pre-tariff shipments from China. Carriers are also employing blank sailings to manage capacity and support rate levels. However, the effectiveness of these rate hikes remains uncertain, given the current market conditions. Source: JOC
Capacity and schedule reliability
Capacity
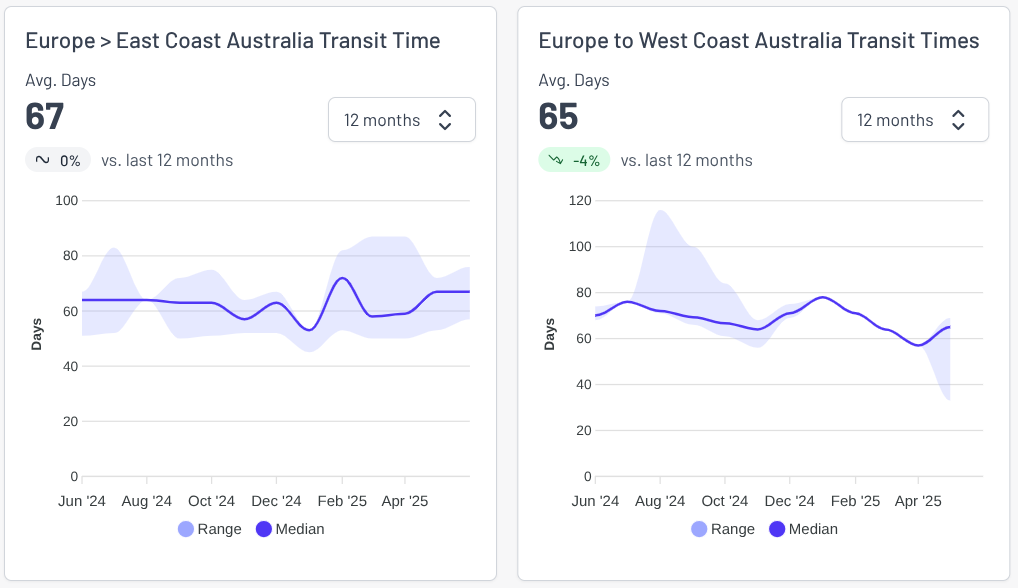
Shipping operations across Northern Europe are facing considerable delays as congestion at major ports like Antwerp, Hamburg, Bremerhaven, and Rotterdam continues to escalate. These disruptions are pushing transit times well beyond normal ranges, with ripple effects felt across connected trade lanes, including services to the Gulf and Asia.
What’s Driving the Delays?
A mix of operational and environmental challenges has been building since the start of the year:
- Berthing delays of 7–10 days are common, stemming from fog-related disruptions, ongoing labour actions, and the reshuffling of vessel services within alliances.
- High yard utilisation—often exceeding 92%—is further slowing productivity.
- "Cut and run" port calls, vessel swaps, and sudden schedule changes are increasingly frequent as carriers try to make up for lost time.
- Emergency measures—like reduced export delivery windows and altered berth priorities—are being implemented to help manage the backlog, but these in turn contribute to further delays.
As a result, transit times from Northern Europe to the Arabian Gulf have stretched from 40–45 days to 55–70 days, and in some cases up to 90 days.
🇧🇪 Belgium – Antwerp
A nationwide union-led action on 20 May caused several vessel delays, resulting in a severe backlog. Some terminals report yard occupancy nearing 100%, with barge delays running 96–144 hours. The imbalance between imports and exports is compounding congestion.
🇩🇪 Germany – Hamburg & Bremerhaven
Both ports are under pressure, with extended berthing delays worsened by the upcoming Pentecost holiday. While terminal productivity remains relatively strong, overall congestion is pushing schedules further off course.
🇫🇷 France – Le Havre
Le Havre is facing berthing delays of up to 6 days as congestion persists across the French coast.
🇳🇱 Netherlands – Rotterdam Terminals
- ECT Delta: Recently lifted truck restrictions but still facing long turnaround times and yard congestion. Barge delays: 48–72 hours.
- Delta II: A labour shortage is impacting all aspects of port operations. Vessel move limits and scan bottlenecks persist. Barge delays: 72–96 hours.
- APM Maasvlakte II: Congested but stable. Transshipment cargo is moving slower due to limited barge availability. Barge delays: 24–36 hours.
- RWG: Yard utilisation has improved slightly. Empty containers are being accepted again, but congestion continues. Barge delays: 48–72 hours. Accelerated cargo pickup is encouraged.
🇬🇧 United Kingdom
- London Gateway: Erratic vessel rotations and ad-hoc transhipment through Southampton or Rotterdam are delaying deliveries. Yard utilisation has improved, but berth congestion and vessel diversions are still ongoing.
- Southampton: Supporting diverted vessels from London Gateway. Vessel wait times average 1.61 days, and terminal utilisation has improved. Landside delays and rail issues are showing signs of recovery.
Schedule reliability
Port congestion across Northern Europe is intensifying and is anticipated to persist into July, driven by a confluence of factors including labor shortages, low water levels on the Rhine River, and shifting trade patterns. According to Drewry, a maritime consultancy, waiting times for berth space have surged—Bremerhaven experienced a 77% increase between late March and mid-May, while Antwerp and Hamburg saw rises of 37% and 49%, respectively. The temporary rollback of U.S. tariffs on Chinese imports has led to a surge in shipping demand, further straining port capacities. Additionally, the ongoing Red Sea disruptions have forced vessels to reroute around southern Africa, exacerbating delays. Industry leaders, such as Hapag-Lloyd's CEO Rolf Habben Jansen, suggest that it may take another six to eight weeks to alleviate the congestion. Meanwhile, the looming threat of increased U.S. tariffs on European goods adds to the uncertainty, potentially impacting transatlantic trade flows and shipping rates. Source: GCaptain
Global air freight
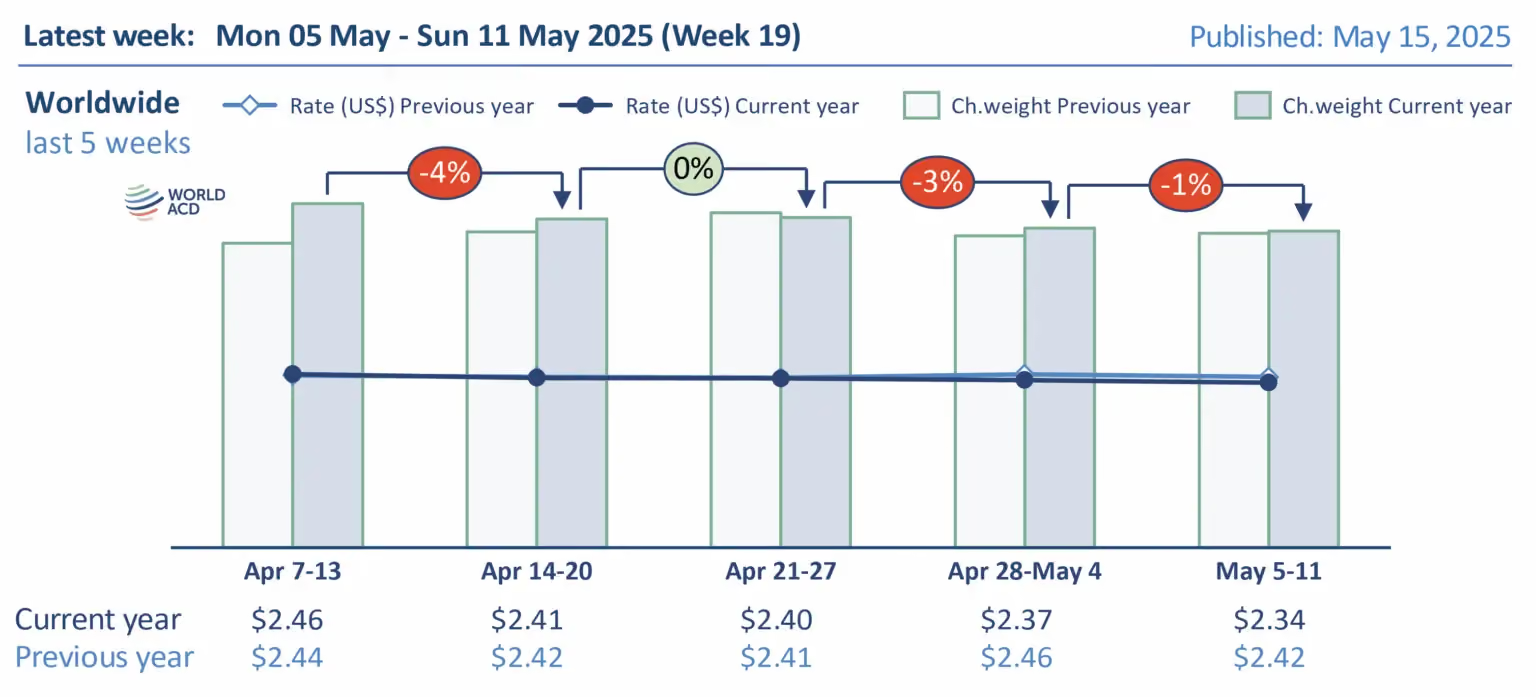
Global airfreight demand continued to soften in early May, with chargeable weight falling by 1% in Week 19 (May 5–11) compared to the previous week. This marks the latest in a string of declines stretching back to early April, interrupted only briefly in Week 17. Over a two-week comparison, total global tonnage dropped by 3%, driven largely by sharp declines from Asia Pacific (-8%) and Central/South America (-5%). The drop from CSA followed the seasonal end of flower exports tied to Mother’s Day, while Asia Pacific’s fall was compounded by the impact of China’s ‘Golden Week’ and uncertainty surrounding U.S. tariffs. Meanwhile, Europe (+2%) and North America (+3%) posted modest growth, reflecting a post-Easter and Labor Day recovery. However, the end of the U.S. ‘de minimis’ exemption for Chinese imports under $800 on May 2 further dampened traffic from China to the U.S., reinforcing the global downtrend.
As demand weakened, global airfreight rates declined for the fourth consecutive week, dropping to $2.34 per kilogram, a 2% decrease from Week 18 and 3% lower than the same week in 2024. Rates fell across most regions, particularly on routes from North America to Asia Pacific (-5%), Asia Pacific to North America (-4%), and Europe to North America and Central/South America (both -3%). The exception was pricing from North America and Europe, which edged up due to temporary post-holiday volume recoveries. Adding to the pressure on air cargo was a 2% global drop in capacity, led by a 5% reduction in Asia Pacific lift. Only Europe saw a slight capacity increase. Uncertainty around tariff policy and a slump in ocean freight rates—which made sea shipping more cost-effective—also contributed to a weakening airfreight market, as many companies paused sourcing and delayed shipments while watching for economic and regulatory clarity. Source: World ACD
Airfreight demand from China to the U.S. took another hit in early May, deepening the slump already triggered by trade tensions and policy shifts. The recent termination of the U.S. ‘de minimis’ exemption significantly accelerated the downturn, with chargeable weight from China and Hong Kong to the U.S. dropping 10% in Week 19 (May 5–11), following a 14% decline the week before, which was partially influenced by Labor Day holidays. Compared to the same week in 2024, volumes were down a staggering 27%, marking the fourth consecutive week of double-digit year-on-year declines. In contrast, airfreight traffic from Asia-Pacific to Europe remained steady, with chargeable weight from China and Hong Kong to Europe showing no significant change week over week.
Looking ahead, the sudden and temporary halt in U.S.-China tariff escalation may prompt a short-term spike in airfreight activity, as shippers rush to move goods before higher duties are reinstated. The 90-day suspension has reduced tariffs on Chinese-origin shipments, potentially restoring some interest in airfreight for small parcel delivery. However, unlike postal shipments, non-postal parcels must go through customs clearance, which introduces extra costs and delays—factors that could dampen the appeal of air transport despite the more favorable duty environment. With container shipping capacity already tight, any surge in demand could further strain logistics networks. Source: World ACD
Capacity and space for AU imports
Shanghai (PVG)
Sydney (SYD)
- MU: Space available from May 29; freight rate increase.
- HO, SQ, MH: All carriers have increased freight rates.
Melbourne (MEL)
- MU: Space available from May 28.
- HO: Space opens from May 31.
- MH, SQ: Freight rate increases in effect.
Brisbane (BNE)
- MU: Space available from June 3.
- SQ: Space available from May 29 with freight rate increases.
Auckland (AKL)
- MU: Space remains tight, some availability from June.
- NZ: Cancelled space on D2/4; limited availability until June.
- SQ: Freight rate increase; 1st leg available from May 29.
Beijing (PEK)
Sydney (SYD) / Melbourne (MEL)
- JD: Freight rate increase. Space to SYD from June 5; to MEL from June 3. Heavy goods preferred.
- CX, SQ: Freight rate increases across the board.
Brisbane (BNE)
- SQ: Freight rate increase; space available from June 5.
Auckland (AKL)
- SQ: Freight rate increase; space available from June 5.
Shenzhen (SZX) / Hong Kong (HKG)
Sydney (SYD)
- CZ: Freight rate stable; space from May 28. Heavy goods welcomed.
- HU: Freight rate increase; space for second leg from June 5.
Melbourne (MEL)
- HU: Freight rate increase; heavy goods encouraged.
Auckland (AKL)
- HU (from SZX): Freight rate decreased; preference for heavy goods.
Guangzhou (CAN)
Sydney (SYD)
- SQ: Space available from June 3; freight rate increase.
- CZ: Space opens from May 31; heavy goods encouraged.
- CA: Freight rate increase.
Melbourne (MEL)
- SQ: Space from June 3.
- CZ: Freight rate stable.
- CA: Freight rate increase.
Brisbane (BNE)
- SQ: Special Wednesday offer available.
- CZ: Freight rate increase.
Auckland (AKL)
- CZ, CA: Freight rates remain stable.
Global shipping overview
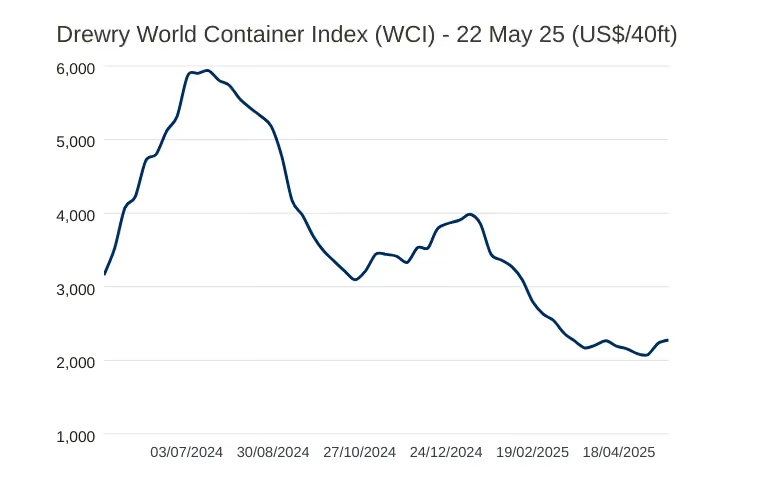
- The latest Drewry World Container Index (WCI) rose by 2% to reach $2,276 per 40ft container, reflecting a significant shift from pandemic-era highs. While this figure is 78% below the September 2021 peak of $10,377, it remains 60% above the pre-pandemic 2019 average of $1,420, signaling a new normal for global freight rates.
- Year-to-date, the average composite index stands at $2,723, which is $174 below the 10-year average of $2,897—a figure that was notably skewed by the extreme volatility during the Covid-19 period (2020–2022). Source: Drewry
Upcoming Global Public Holidays
Bangladesh: Eid al-Adha Holiday: 5th - 10th June
General news
- On May 26, 2025, South Australia experienced severe weather, including wind gusts up to 126 km/h, heavy rainfall, and abnormally high tides, leading to widespread power outages and infrastructure damage. The Bureau of Meteorology reported sea levels reaching 4.51 meters above the lowest astronomical tide at Port Pirie, with many coastal areas experiencing significant storm surges. Source: ABC News
- On May 27, 2025, a severe dust storm swept across New South Wales, significantly impacting Greater Sydney's air quality. The storm, driven by strong westerly winds, transported dust from drought-affected regions in South Australia and western Victoria, enveloping Sydney in an orange haze and reducing visibility. Air quality measurements recorded hazardous levels of particulate matter (PM10), with readings exceeding 600 µg/m³ in several areas. Notably, Prospect reported 693.3 µg/m³, and Illawarra peaked at 903.2 µg/m³, surpassing pollution levels typically observed in some of the world's most polluted cities. Source: Watchers News
- China has criticized Australia's plan to reclaim the Port of Darwin from Chinese company Landbridge Group, which secured a 99-year lease in 2015. Chinese Ambassador Xiao Qian labeled the move as "ethically questionable," arguing that Landbridge made significant investments to improve the port's operations and contribute to the local economy. He contended that it is unfair to target the company now that the port has become profitable. The Australian government, citing national security concerns due to the port's strategic location and its proximity to U.S. military operations, has expressed intentions to return the port to Australian ownership, potentially through compulsory acquisition if no private buyer is found. Landbridge maintains that the port is not for sale. Source: GCaptain
- On May 25, 2025, the Liberian-flagged containership MSC ELSA 3 sank approximately 14.6 nautical miles off the coast of Kochi, India, after developing a severe list due to technical issues and adverse weather conditions. All 24 crew members were safely rescued, with 21 evacuated by the Indian Coast Guard and the remaining three, including the captain, by the Indian Navy. The vessel was carrying 643 containers, including 13 with hazardous materials such as calcium carbide, as well as significant quantities of diesel and furnace oil. The sinking has resulted in a substantial oil and chemical spill, prompting the Kerala government to declare a statewide emergency. The Indian Coast Guard has launched containment efforts, deploying ships and aircraft equipped with pollution response tools to manage the spill and recover drifting containers. Authorities have issued public warnings to avoid contact with any floating debris, emphasizing the potential dangers posed by the hazardous cargo. Fishing activities within a 20-nautical mile radius have been suspended to ensure safety and facilitate cleanup operations. Source: GCaptain
Interesting Articles
- ONE opts for South Korean newbuilds to avoid hefty US port fees
- Joint Maritime Information Center issues advisory following Houthis' latest threats against commercial shipping
- MSC ship loaded with chemicals sinks off southern India
- Nike to Raise Prices, Citing ‘Seasonal Planning’
- Trump threatens EU and Apple with trade tariffs
.avif)
Experienced Business Development Manager with a demonstrated history of working in the logistics and supply chain industry. Skilled in Import/Export, Freight Transportation, Freight, Warehouse Operations, and Overseas Networking.
Frequently Asked Questions
Explorate gives supply chain managers one real-time view across ever forwarder, lane and mode without replacing your current process, partners or systems.

