
.avif)
Australia
Australia

Effective 9 June 2025, Hutchison Ports will implement revised Landside Infrastructure and Ancillary Charges at its Sydney and Brisbane terminals. The increases are being introduced as a partial offset to rising operational costs, including maintenance, energy expenses, land rental, and other overheads.
Infrastructure Levy / Terminal Access Charge Adjustments
Sydney Terminal
- Import containers: Increasing 10%
- Export containers: Increasing 7%
Brisbane Terminal
- Import containers: Increasing 8%
- Export containers: Increasing 7%
Ancillary Fees Across Both Terminals
Additional charges—including truck slot bookings, sideloader fees, storage, and other surcharges—will also see adjustments, with increases expected of around 15%.
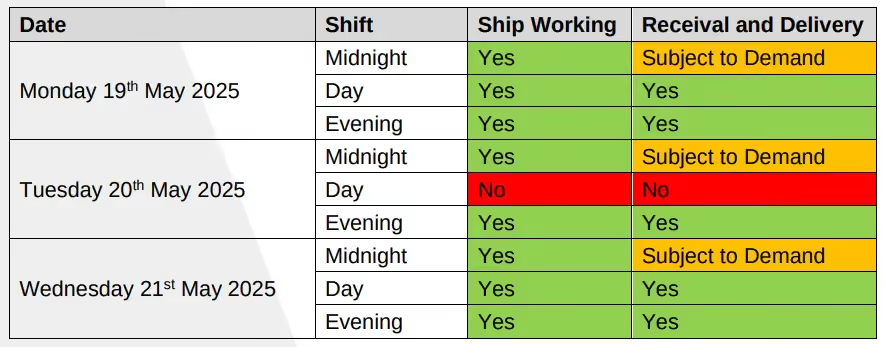
Patrick, Fisherman Islands Terminal, will cease all ship and yard operations between 0700 – 1500 on Tuesday 20th May 2025 to conduct yard infrastructure and system maintenance.
North East Asia
North East Asia

Ocean freight rates

- NEAX (A1X) Service: Operated by HMM, EMC, ONE, and HPL—rates dropped by 10–15% for the second half of May.
- Premium Services: Loops such as the A3S, A3C, A3N, JKN, and CNS (run by COSCO, ANL, and OOCL) took a major pricing tumble of up to 25%. Originally projected to hold above USD 1,200 per TEU, final market rates plunged below USD 1,000 per TEU.
- West Coast Stability: Unlike the fluctuating East Coast lines, freight rates to Fremantle and Adelaide (FRE/ADL) held completely steady throughout the month with no notable pricing changes.
Capacity and schedule reliability

Capacity
- The Transpacific Void: In response to sudden U.S.–China tariff policy changes, carriers drastically shifted capacity out of secondary trade lanes to cover a massive demand surge on U.S. routes.
- Carrier Capacity Siphoning & Cancellations:
- COSCO: Postponed a highly anticipated structural vessel capacity upgrade on the A3N service to keep its current resource footprint lean.
- CMA CGM: Announced two ad-hoc extra loader sailings from North and South China to Australia scheduled for May 12th, but final space deployment remains volatile and under constant policy review.
- Blank Sailings: The premium A3 service executed strategic blank sailings in Weeks 21 and 23 directly out of South China ports. The JKN service also implemented a blank sailing in Week 23 ex South China.
- COSCO: Postponed a highly anticipated structural vessel capacity upgrade on the A3N service to keep its current resource footprint lean.
- Equipment Deficits: Severe container equipment imbalances and empty container shortages have emerged across Oceania due to these widespread canceled loops, with normal equipment repositioning timelines expected to lag by 6 to 8 weeks.
Schedule reliability
Severe anchorage pile-ups and heavy localised weather delays have drastically lowered vessel schedule integrity across China:
- Primary Chinese Gateways: Shanghai, Qingdao, and Hong Kong ports are heavily gridlocked, forcing arriving container ships into berth waiting times of up to 4 days.
- The Illusion of Recovery: A short burst of increased vessel activity in early May created a false impression of schedule stabilisation; however, port intelligence confirms this was simply a temporary bottleneck caused by previously skipped sailings bunching up and hitting ports simultaneously.
South East Asia
South East Asia
.avif)
Ocean freight rates

- ZAX (PANDA) Service: Jointly operated by MSC and ZIM—pricing was aggressively adjusted downward to follow shifting market baseline conditions, locking in a 10–15% rate decrease for the back half of May.
- GRI Suppression: While regional lines initially attempted to match global rate baselines, local equipment gaps and space reallocations have forced regional FAK pricing down to remain competitive against North Asian direct routes.
Capacity and schedule reliability
Capacity
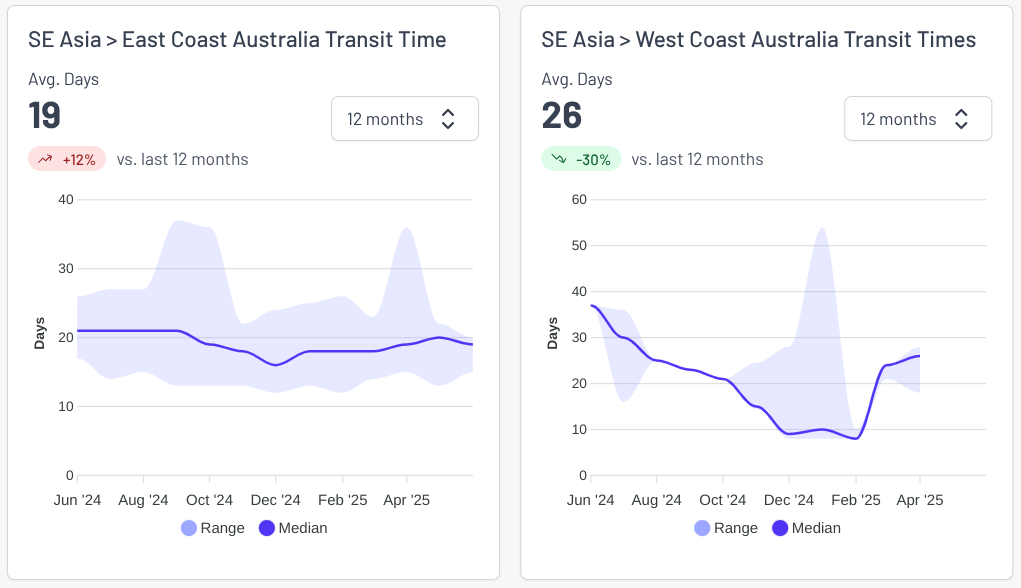
- Transhipment Rollovers: Space availability via regional logistics hubs is heavily restricted due to processing backlogs. Connecting feeder cargo is running into immense delays, with transhipment bookings in primary lanes regularly being rolled by up to 2 weeks.
- Regional Supply Chain Rations: Due to structural equipment positioning gaps stemming from canceled long-haul services, spot container availability is severely constrained across major manufacturing zones.
Schedule reliability
Systemic operational gridlock continues to damage transit reliability across secondary transhipment loops:
- Singapore Hub: Remains heavily bottlenecked by vessel bunching and severe yard overcrowding, with standard vessel waiting times stretching up to 3 days.
- Port Klang (Malaysia): Terminal yard utilisation has broken past critical levels to sit above 80% capacity. This dense container stack configuration has slowed down handling speed, severely crimping overall port throughput.
- Vietnam: Experiencing a progressive deterioration in schedule reliability, with vessel turnaround times tracking multi-day delays due to downstream port omissions and feeding delays.
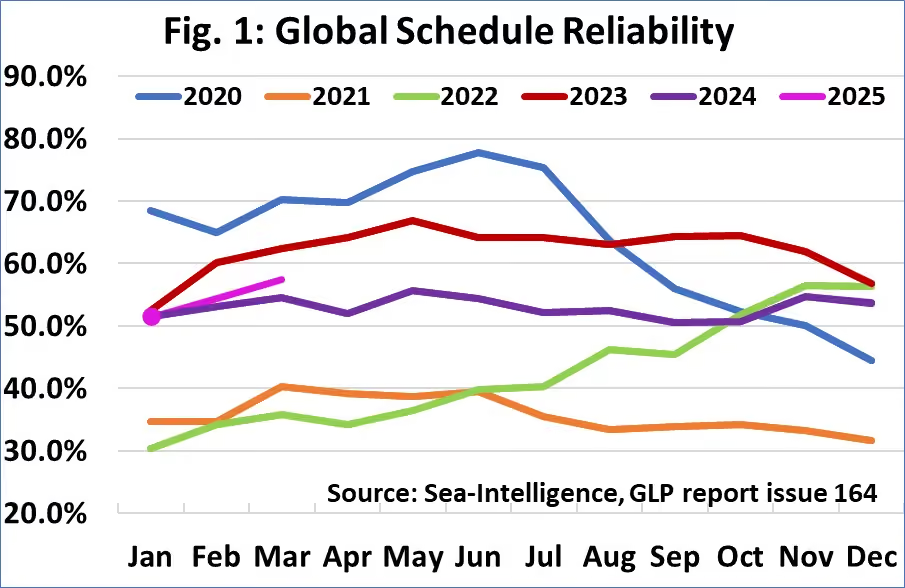
In March 2025, global schedule reliability rose by 3.0 percentage points month-over-month, reaching 57.5%—the highest level seen since November 2023. Compared to the same period last year, this marks a year-over-year improvement of 3.0 points. Among the top 13 carriers, Maersk led the pack with a reliability rate of 66.9%, followed by Hapag-Lloyd at 64.3% and MSC at 61.9%.
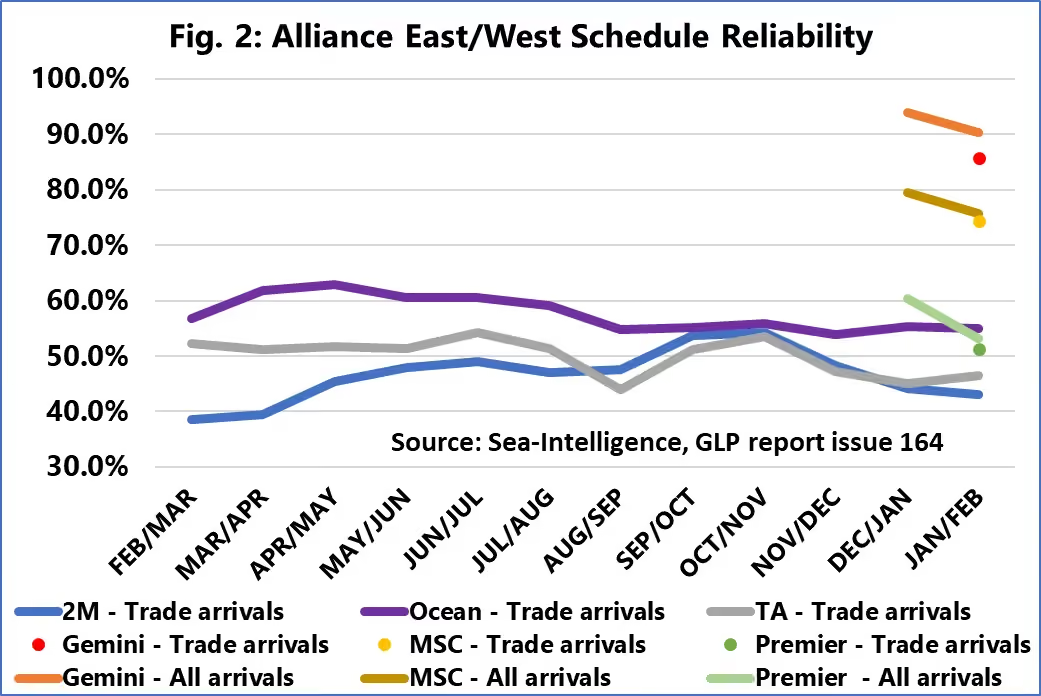
In March 2025, the new alliance services recorded their first vessel arrivals on a full trade lane basis, whereas in February, arrivals were limited to origin regions within the East/West trades. Traditionally, our alliance performance scores are calculated based on arrivals in destination regions. However, since this data wasn’t available for the new alliances in February, we introduced an interim metric that includes all port calls—both origin and destination—to ensure continuity in reporting.
In this update, we’re presenting both metrics:
- “All Arrivals”: Includes both origin and destination calls, consistent with February’s measurement for new alliances.
- “Trade Arrivals”: Reflects only destination calls, aligned with how we’ve historically measured the performance of established alliances.
As the rollout of the new alliances progresses, these two metrics are expected to align. Source: Sea Intelligence
Container shipping operations along India's west coast are experiencing significant disruptions due to recent regional tensions and heightened security measures. Despite a ceasefire between India and Pakistan, the aftermath of these tensions has led to delays and vessel omissions at key ports such as Nhava Sheva (JNPT) and Mundra. Enhanced security protocols have further compounded these issues, affecting the reliability of container supply chains in the region.The Indian government's recent ban on Pakistan-origin cargo has effectively halted direct vessel calls to Pakistani ports like Karachi and Port Qasim on services that also call at Indian ports. This has forced carriers to adjust their schedules, leading to increased transit times and operational uncertainties for shipments in the region. Source: JOC
ANL: Please be advised that due to operational requirements, MAERSK FREMANTLE 517S will omit the southbound Brisbane call.
The below contingency plan has been secured for affected cargo:
- Cargo onboard MAERSK FREMANTLE 517S for Brisbane discharge will remain onboard the vessel through Sydney and will now discharge from the vessel on the Brisbane northbound call.
- Cargo scheduled to load MAERSK FREMANTLE 517S ex Brisbane will be updated to load MYNY 518S.
ANL: Please note the MV MATHILDE SCHULTE 5413 will omit Melbourne to recover schedule due to weather delays.
North America
North America

Ocean rates
- Carriers have implemented General Rate Increases (GRIs) on the TPEB trade effective early May, and those increases have taken hold, at least in the short term.
- Shanghai → Los Angeles: $2,713 per 40ft container (↑ 5% / $123)
- Shanghai → New York: $3,646 per 40ft container (↑ 4% / $146)
Los Angeles → Shanghai: $706 per 40ft container (↑ 2% / $17)
-
Capacity
- The Trans-Pacific Eastbound trade lane is facing ongoing capacity constraints, with vessel space currently tracking well below typical seasonal levels. This is largely due to weak demand ex-China, prompting carriers to withdraw sailings to rebalance supply. While volumes have held steady since mid-April, there's been no uptick from Southeast Asia to offset the shortfall.
- A short burst of increased vessel activity in early May created the illusion of recovery, but this was mainly due to previously skipped sailings bunching up in the schedule. Looking ahead, the trend points downward again, with significant cuts already scheduled for the second half of May.
- Several key services on the Transpacific Eastbound trade lane have been temporarily or indefinitely suspended as carriers adjust capacity in response to soft market conditions.
- The Ocean Alliance (CMA CGM, COSCO, Evergreen, and OOCL) has paused multiple loops, including PRX, CP1, PCS1, and AAS2 from Weeks 17 through 26. Other suspended services include SEA3 and PSX (Weeks 18–23), CPS, AAC2, HBB, and PCN3 (Weeks 17–21), as well as CBX, ECC3, and AWE7, suspended from Week 16 through Week 24.
- Mediterranean Shipping Company (MSC) has halted its ORIENT service beginning Week 16 with no set return date. Similarly, ZIM has suspended its ZX2 loop indefinitely starting in Week 16.
- The Premier Alliance (ONE, HMM, and Yang Ming) has put its PN4 and PS5 loops on hold before their scheduled launches in May, suspending them until further notice.
- Additionally, two joint services operated by MSC and ZIM—the PELICAN/ZSL loop and the EMPIRE/ZNS loop—are being suspended beginning in Weeks 19 and 20 respectively, with no announced reinstatement dates.
- These changes reflect the broader capacity rebalancing underway across the TPEB network, as carriers respond to ongoing demand volatility.
- The unexpected 115% reduction in U.S. tariffs on Chinese goods came as a response to mounting pressure on U.S. import volumes, which had threatened to impact retail stock levels in the near term. With this relief now in place, import activity is projected to rebound sharply—potentially surpassing the record highs experienced during the COVID-era surge of 2021–2022 over the next three months. Source: Linerlytica
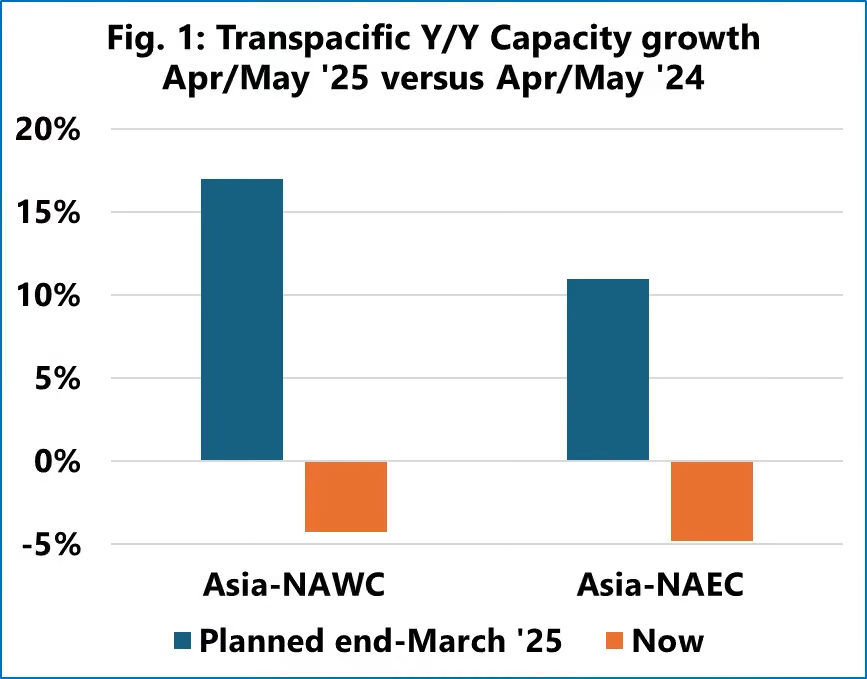
- In April and May 2025, the Transpacific shipping lanes experienced a year-over-year capacity reduction of approximately 4.3% to the U.S. West Coast and 4.9% to the East Coast. This shift contrasts with earlier plans to increase capacity by 17% and 10.9%, respectively. The change is attributed to a surge in blank sailings—accounting for 17% to 19% of planned capacity—and the deployment of smaller vessels. These adjustments were prompted by a significant decline in Chinese export bookings, estimated between 30% and 50%. While increased demand from other Asian regions may offset some of this shortfall, it's unlikely to fully compensate, potentially leading to further blank sailings and a drop in spot rates in the near future. Source: Sea Intelligence
- Oceania Imports: As peak season pressures subside, available space has increased and freight rates have begun to taper off. U.S. East Coast ports have regained operational stability, with congestion easing and direct services returning to consistent schedules—April 2025 marked a period with no skipped calls. In contrast, shipments routing through Asia into Oceania are facing growing delays, as heavy congestion at key Asian transshipment hubs begins to disrupt flow and timing downstream.
Schedule Reliability
The Ports of Los Angeles and Long Beach, key gateways for trans-Pacific trade, are witnessing a significant drop in import volumes. In April, U.S. container imports surged by 9.1% year-over-year, driven by companies expediting shipments ahead of newly imposed tariffs. However, this trend is reversing in May, with the Port of Los Angeles expecting a 35% decline in import cargo and the Port of Long Beach forecasting a 20% year-over-year drop. This decline is attributed to soft demand, shipping cancellations, and uncertainties stemming from fluctuating trade policies and international geopolitical tensions.
Port executives have expressed concerns about potential disruptions reminiscent of the COVID-19 pandemic if key trade agreements are not secured. Mario Cordero, CEO of the Port of Long Beach, highlighted the seriousness of the threat, noting that recovery of cargo flow to normal levels could take at least a month after finalizing major trade deals.
US Tariffs
Key updates (as at 15 May 2025):
Shipping Market Update: Industry Response to Recent Tariff Developments
1. US-Bound Vessel Cancellations and Recovery Timeline
Over 85% of sailings to the United States were canceled during April and early May. Carriers have since begun rescheduling services, with a full recovery in sailing frequency anticipated within the next 4 to 6 weeks.
2. Booking Constraints on U.S. Services
In the wake of the U.S.–China tariff reduction, demand has surged. Most U.S.-bound sailings for May are fully booked, and several carriers have temporarily closed their booking platforms until additional capacity is deployed.
3. COSCO Service Adjustments
COSCO has rerouted two vessels from its Middle East service to support increased demand on U.S. lanes. Additionally, the planned vessel upgrade on the A3N service has been postponed.
4. CMA CGM Adds Extra Sailings
CMA CGM announced two ad-hoc sailings from North and South China to Australia scheduled for May 12. However, final deployment remains subject to review based on the evolving impact of the tariff policy shift.
5. Equipment Shortages in Oceania and South Asia
Container imbalances are emerging across Oceania and South Asia due to canceled services and delays in equipment repositioning. Recovery of container availability in these regions may take 6 to 8 weeks.
6. Service Rationalisation in Other Regions
As carriers redirect assets to capitalize on rising demand in U.S. trade lanes, vessel withdrawals are likely across Southeast Asia, India–Pakistan, Australia–New Zealand, and Red Sea routes.
👉 Read the full update in our Dedicated Tariffs Blog.
Europe
Europe
.png)
Ocean freight rates

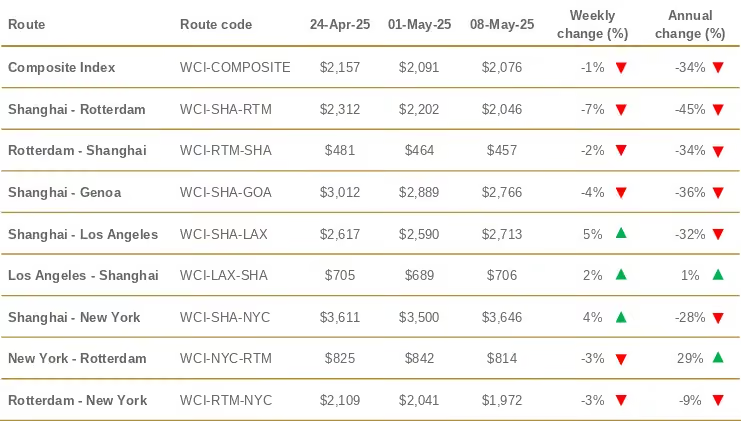
- Shanghai → Rotterdam: $2,046 per 40ft container (↓ 7% / $156)
- Shanghai → Genoa: $2,766 per 40ft container (↓ 4% / $123)
- New York → Rotterdam: $814 per 40ft container (↓ 3%)
- Rotterdam → New York: $1,972 per 40ft container (↓ 3%)
- Rotterdam → Shanghai: $457 per 40ft container (↓ 2% / $7)
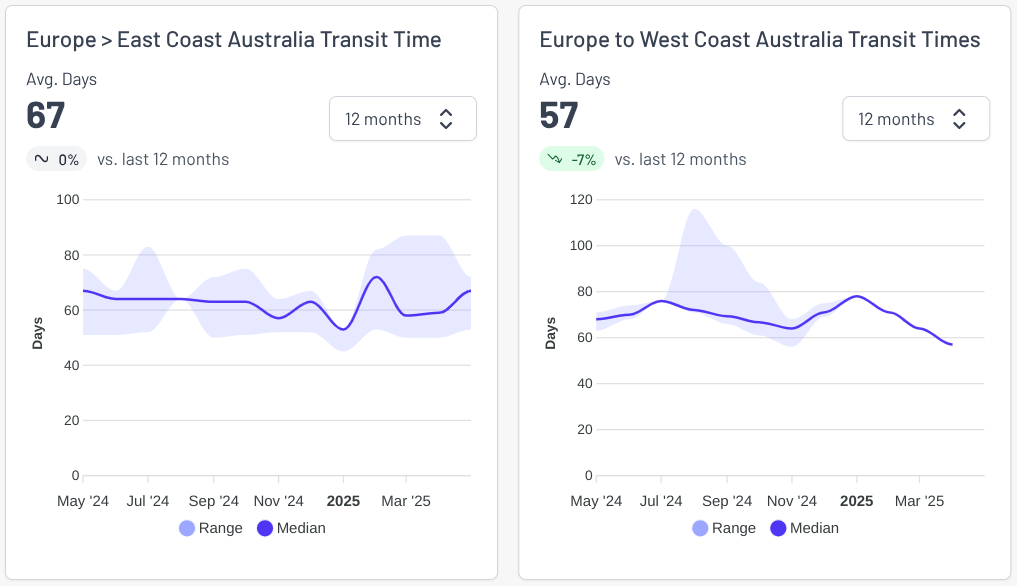
Rates ex Europe hubs into Australia remain stable into June.
Capacity and schedule reliability
Capacity
- The Asia–Europe trade remains sluggish, with vessel backlogs at major North European ports disrupting schedules and limiting effective weekly capacity. Compounding the issue, carriers are redeploying idle ships from the quieter Trans-Pacific routes into this lane, flooding the market with additional space and pushing spot rates into a fresh decline.
Schedule reliability
- Ports such as Antwerp, Rotterdam, Hamburg, and Bremerhaven are experiencing acute congestion due to a confluence of factors. High yard occupancy rates—Antwerp reports 96% utilization with reefer plugs over capacity at 112%—are causing berthing delays, with nearly half of arriving vessels waiting for slots. Contributing factors include labor shortages, recent strikes, and the implementation of new shipping alliances, notably the Gemini Cooperation between Hapag-Lloyd and Maersk, which have disrupted established schedules .
- Inland transport bottlenecks further exacerbate the situation. Low water levels on the Rhine River have limited barge capacity, shifting more freight to already strained rail and road networks. For instance, landslides near Hannover have forced lengthy rail detours, impacting traffic to and from major ports.
- Mediterranean ports, including Piraeus, Genoa, and Valencia, are also facing mounting congestion. Piraeus is experiencing berth wait times of 4.4 days for mainline vessels and up to six days for feeder services. Italian ports like Genoa and La Spezia report average delays of around four days. These delays are attributed to a combination of factors such as labor shortages, high yard occupancy, and the ripple effects of disruptions in Northern Europe.
- In July 2025, the Port of Hamburg is scheduled to undergo significant rail disruptions due to extensive construction work associated with the A26-West motorway project. From July 11 at 07:00 to July 15 at 07:00 local time, rail access to key western terminals—including Altenwerder, Burchardkai, Eurogate, and Hansaport—will be completely closed. This closure is expected to impact the movement of approximately 13,500 to 35,000 TEU, affecting both import and export volumes. Source: MyKN Maersk
- The Port of Antwerp is preparing for a National Day of Action on Tuesday, 20 May 2025, as multiple unions, including members of the Maritime and Coastal Services Agency (MDK) and the Port of Antwerp-Bruges, plan to participate in a strike. In anticipation of the labor action, PSA Antwerp has announced a suspension of truck export deliveries starting from 22:00 on Monday, 19 May, until 06:00 on Wednesday, 21 May. During this period, only import pick-ups will be processed, while export deliveries will not be accepted. Empty container processing will continue, and gate checks will be conducted to ensure compliance with these measures. Shippers and logistics providers are advised to plan accordingly to mitigate potential disruptions. Source: Yang Ming
Global air freight
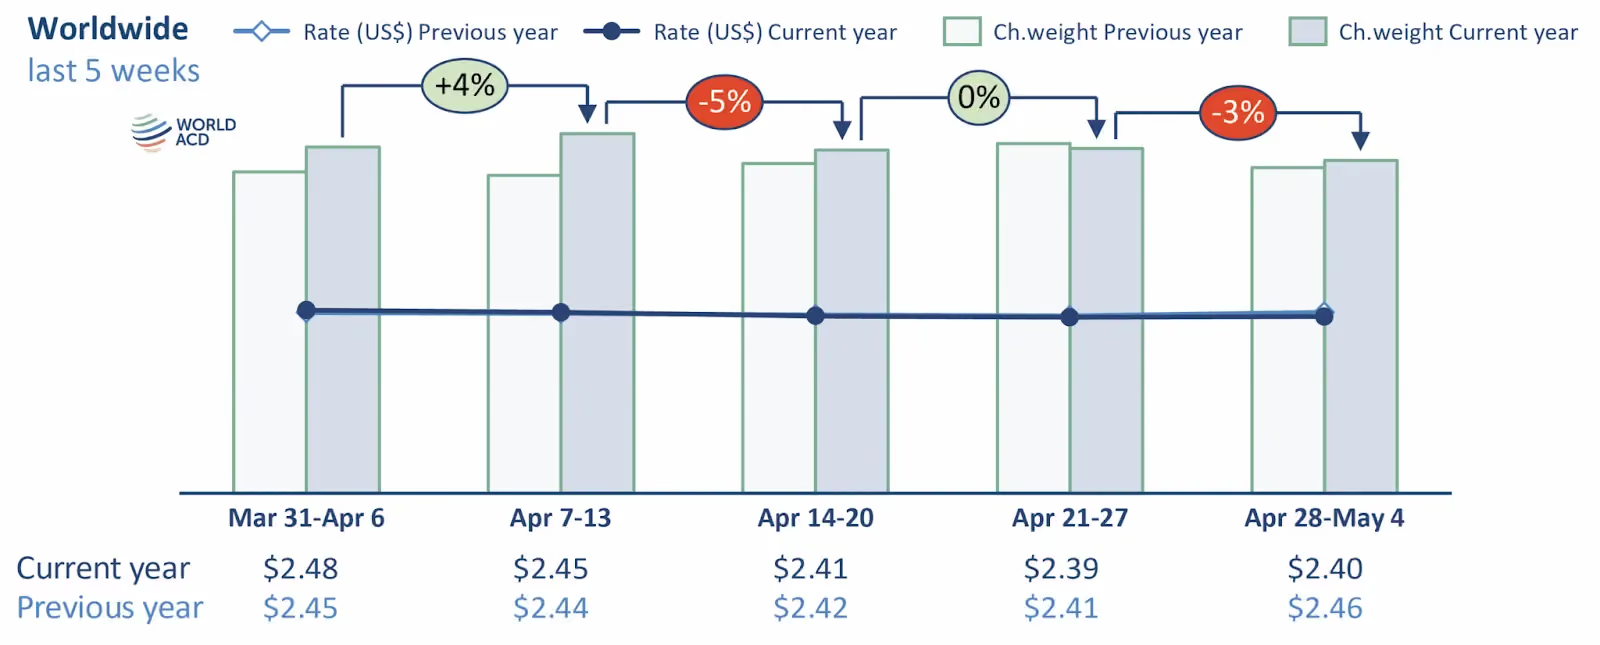
In Week 18 of 2025 (April 28–May 4), global air cargo tonnage declined by 3%, largely due to an 11% drop in volumes from the Asia Pacific region. This was driven by the May 1st Labor Day holidays and Japan’s Golden Week, with Japan seeing a sharp 45% reduction in outbound shipments. The China and Hong Kong to U.S. trade lane also saw notable declines.
Despite the volume drop, average air cargo rates from APAC rose 3%, mainly due to a shift in shipment mix rather than increased demand. Lower-yield intra-Asia traffic fell significantly, increasing the share of higher-yield shipments. Excluding intra-Asia, average rates from APAC actually dropped 1%.
Looking ahead, the removal of the U.S. 'de minimis' exemption for China and Hong Kong (effective May 2) is expected to further disrupt APAC air freight, with early reports indicating canceled or rerouted freighter services. These impacts will likely be reflected in Week 19’s data. Source: World ACD
Capacity and space for AU imports:
🇦🇺 Sydney (SYD)
- From PVG:
- MU: Rates steady, space available from May 14
- HO: Rates increasing, space from May 16
- MH: Space available
- PR/SQ: Freight rates increasing
- From PEK:
- JD: Rates stable, space from May 15
- CX/TG: Rates stable
- From SZX/HKG:
- CZ: Space from May 16, but tight overall
- HU: Prefers heavy cargo, space from May 17
- From CAN:
- SQ: Space from May 20, shortage of heavy cargo
- CX: Prefers light goods
- CZ: Actively seeking heavy cargo
🇦🇺 Melbourne (MEL)
- From PVG:
- MU: Space from next week, rates increasing
- HO: Space from May 17, rates increasing
- MH: Space available
- From PEK:
- JD: Rates stable, space from May 15
- CX/TG: Rates stable
- From SZX/HKG:
- HU: Rates stable, space from May 16
- MF: Space from May 19, rates increasing
- From CAN:
- SQ: Space from May 20, shortage of heavy cargo
- CZ: Clearing backlogged cargo
🇦🇺 Brisbane (BNE)
- From PVG:
- MU: Carton space from May 15, pallet space from May 17
- SQ/PR: Rates increasing
- From PEK:
SQ: Rates increasing, space from May 19 - From CAN:
- SQ: Space from May 20
- CZ: Space available for cartons
Global shipping overview
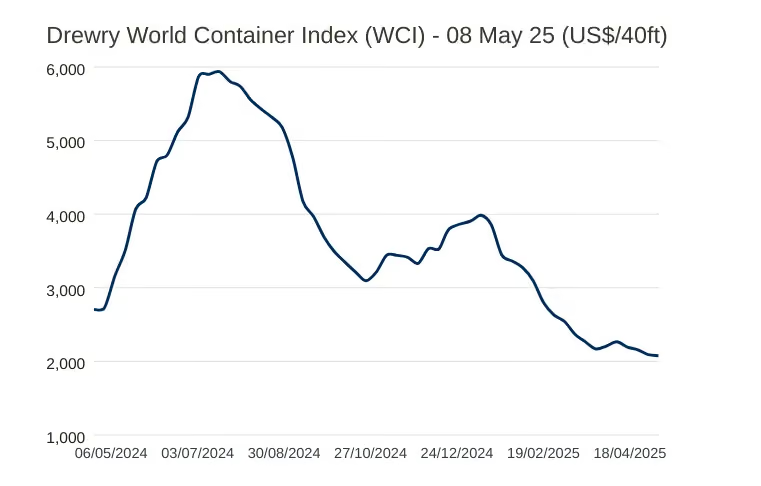
- Composite Index: The WCI composite index decreased by 1% to $2,076 per 40-foot container. This rate is 80% below the pandemic peak of $10,377 in September 2021 but remains 46% higher than the pre-pandemic average of $1,420 in 2019.
- Year-to-Date Average: The average composite index for the year-to-date stands at $2,773 per 40-foot container, reflecting the ongoing adjustments in the global shipping market.
- Route-Specific Trends: While specific route data for this week isn't detailed in the provided information, previous assessments have shown varying trends across major trade lanes, influenced by factors such as regional demand fluctuations and capacity adjustments.
The current trajectory suggests that freight rates are stabilizing at levels higher than pre-pandemic averages but significantly lower than the peaks experienced during the pandemic. Shippers and logistics providers should continue to monitor these trends closely, as they have direct implications on budgeting, contract negotiations, and supply chain planning. Source: Drewry
Upcoming Global Public Holidays:
Malaysia: Birthday of the Raja of Perlis: 17th May
Canada: National Patriots Day/Victoria Day: 19th May
Bangladesh: Eid al-Adha Holiday: 5th - 10th June
General news
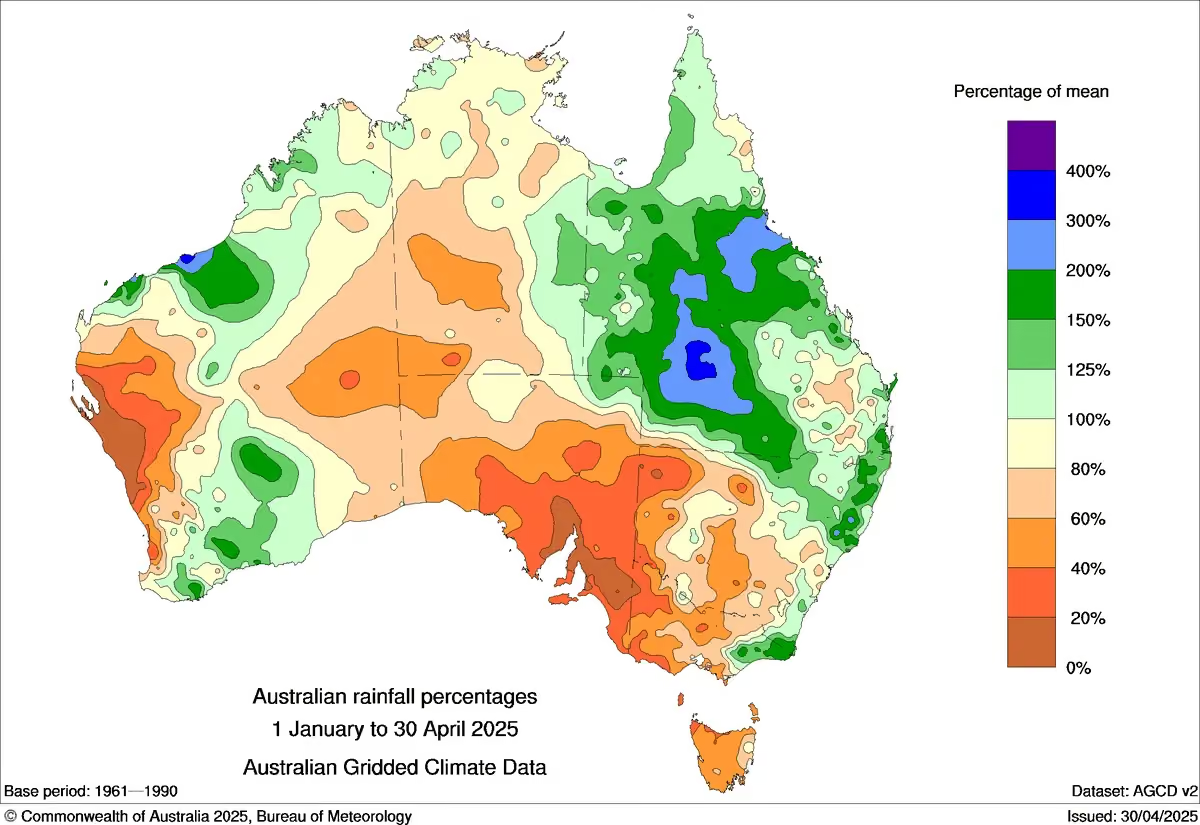
- Victoria and South Australia are experiencing one of their most severe droughts in decades. The first four months of the year have seen record-low rainfall, with some areas receiving less than 20% of the long-term average. This prolonged dry spell has led to empty dams, barren paddocks, and significant challenges for farmers, particularly in the dairy sector, where feed scarcity and water shortages are prevalent. The Victorian Farmers Federation has called for urgent government assistance to mitigate the financial pressures on producers and prevent long-term damage to rural communities. The Bureau of Meteorology forecasts continued below-average rainfall and higher-than-normal temperatures through August, exacerbating the crisis. Source: 9 News
Interesting Articles
- Ecommerce likely the front-runner in resurge of transpacific trade after deal
- Service chaos from trade ban with India a problem for Pakistan shippers
- Peak season or recession? Forwarders and shippers need to 'stay flexible'
- ALC urges Albanese Government to keep freight policy front and centre
- Volume surge and an early peak season? 'Don't celebrate too soon,' warning
- Storm warning: another active Atlantic hurricane season predicted
.avif)
Experienced Business Development Manager with a demonstrated history of working in the logistics and supply chain industry. Skilled in Import/Export, Freight Transportation, Freight, Warehouse Operations, and Overseas Networking.
Frequently Asked Questions
Explorate gives supply chain managers one real-time view across ever forwarder, lane and mode without replacing your current process, partners or systems.

