
.avif)
North East Asia
North East Asia

- Last week, as General Rate Increase (GRI) notices from major shipping lines flooded the market, the general consensus was that freight rates would see only modest increases during the first half of July. This assumption was largely based on timing: with the financial year having just closed, even a surge in order placements at the end of June would mean shipments wouldn’t realistically hit the water until mid-July, given the typical 2–3 week production lead time.
- However, the unexpected cancellation of numerous sailings in the second half of June has dramatically shifted market dynamics. Each carrier now faces a significant backlog of rolled cargo - commonly referred to as a "roll pool" - which has strengthened their position. As a result, carriers across the board implemented the full GRI (USD 300.00 per TEU) effective 1st July.
- Looking ahead, in addition to riding the anticipated post-financial-year order recovery in Australia, shipping lines have already announced the cancellation of at least four upcoming sailings. This is a deliberate move to tighten capacity and support further rate increases. With a second round of GRI notices already released for the latter half of July, again at USD 300.00 per TEU, it is clear that carriers are aiming beyond a single adjustment. Their objective appears to be a “hat-trick” of rate hikes, potentially pushing spot market levels to over USD 1,400.00 per TEU after 15th July, depending on market response and space availability. There is potential for PSS (Peak Season Surcharge) to be implemented in August, however nothing is yet to be confirmed.
- The Shanghai–Sydney SCFI has remained relatively steady around the USD 1,500 per FEU mark over the past two months, closing at USD 1,490 per FEU in Week 25—up from USD 1,372 in Week 24. For context, the index sat significantly higher at USD 4,294 per FEU in Week 1 of 2025. Source: The DCN
- The situation remains fluid, with changes taking place frequently. We will continue to monitor the market and relay updates as they occur.
Ocean freight rates

Rate summary: 1st July - 14th July 2025
Advertised GRIs:
- ANL: USD400.00 per TEU for all cargo ex North East Asia, South East Asia, Indian Subcontinent, Middle East, and Gulf to PNG, Gladstone & Townsville. Effective 23rd July.
- ANL: USD300.00 per TEU for all cargo ex Northeast Asia to Australia & NZ. Effective from 15th July.
- MSC: USD500.00 per TEU for all cargo ex China, Hong Kong, Japan, Korea, and Taiwan to Australia and New Zealand. Applicable from the 15th July.
- Cosco: USD300.00 per TEU for all cargo ex Northeast Asia to Australia. Effective 1st July.
- ZIM: USD300.00 per TEU for all cargo ex Northeast Asia to Australia. Effective 1st July.
Capacity and schedule reliability
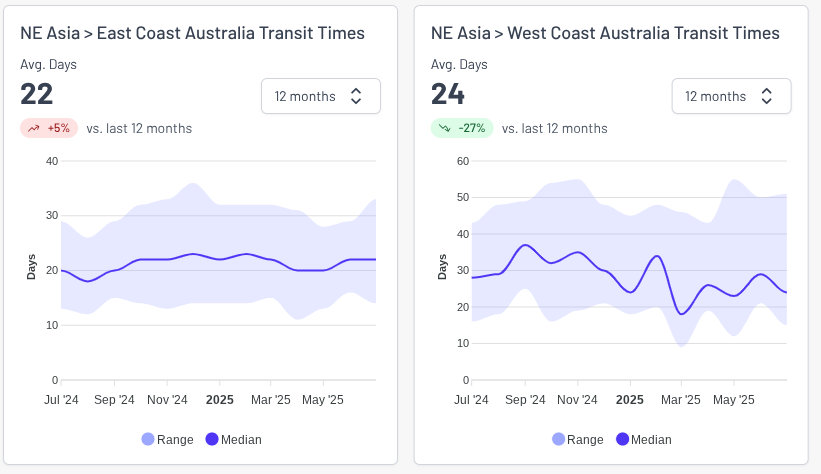
Capacity
- Blank Sailings: The CA2/CAT service is blank sailing in week 27, and the A3 service is blank sailing in week 28.
- Port Omissions: Widespread adjustments have seen multiple carriers omit Brisbane on their southbound leg to recover schedules, adding up to 14 days of transit time for affected cargo.
Port & Weather Reliability
- Northern Chinese Ports: Heavy fog and rough seas caused closures lasting 10 to 26 hours. Roughly 134 vessels were caught waiting near the Shanghai-Ningbo corridor, with another 40 queued outside Qingdao.
- Southern Chinese Ports: Tropical Storm Wutip triggered 10-to-49-hour halts at Yantian, Shekou, and Nansha. The Hong Kong–Yantian area remains heavily congested with 87 vessels anchored.
Schedule Reliability
In recent weeks, several carriers have adjusted their port rotations, with a noticeable trend of omitting Brisbane on the southbound leg to minimise overall schedule delays. While operationally necessary, this adjustment can add up to 14 days to the total transit time for affected containers. These changes are largely driven by a combination of adverse weather conditions and ongoing port congestion across key terminals.
Singapore is also seeing vessel omissions, with carriers working to maintain reliability.
Several sailings scheduled for late June will be pushed into early July.
South East Asia
South East Asia
.avif)
Ocean freight rates

Capacity and schedule reliability
Capacity
- Blank Sailings: The Wallaby service is scheduled to blank sail in week 31.
- Booking Backlogs: Major Southeast Asian hubs are entirely booked out until well into July with several carriers.
Port & Transhipment Reliability
- Singapore: Carriers face a 2-day vessel wait time at anchorage due to high yard utilization. The current container transhipment roll pool is backing up by 1 to 2 weeks. 31 vessels remain anchored outside the Singapore-Tanjung Pelepas corridor.
- Malaysia (Port Kelang): Severe vessel bunching has pushed waiting times up to 3 days, with yard utilization sitting at a critical 95%.
- Thailand (Laem Chabang): A shortage of truck drivers at the Lat Krabang Inland Container Depot (ICD) has blocked empty container drop-offs, while import transfer delays from the main port are pushing out inland lead times.
- Philippines (Manila): Operational efficiency is heavily strained with 14 vessels anchored, creating an average berth wait time of 1.8 days.
India Subcontinent
India Subcontinent
.png)
Bangladesh – Chittagong
At Chattogram Port, yard occupancy remains high and vessel wait times average 5–7 days. Operations at CCT and NCT terminals are under pressure following a recent extended public holiday, which limited handling capacity and yard space. Equipment availability and labour shortages are further compounding delays across the port and container freight stations (CFSs). As of the latest report, 10 vessels are at anchor awaiting berth.
Israel – Ashdod & Haifa
Ports in Ashdod and Haifa are currently operational, though restrictions on Dangerous Goods (DG) cargo are in effect.
- Ashdod and Southern Port will still accept DG cargo but under special handling instructions, subject to change without notice.
- Haifa Port, however, is not accepting DG cargo, and some carriers are rerouting these shipments via Port Said in Egypt.
The situation remains fluid, and carriers may opt to bypass Israeli ports entirely if regional tensions escalate.
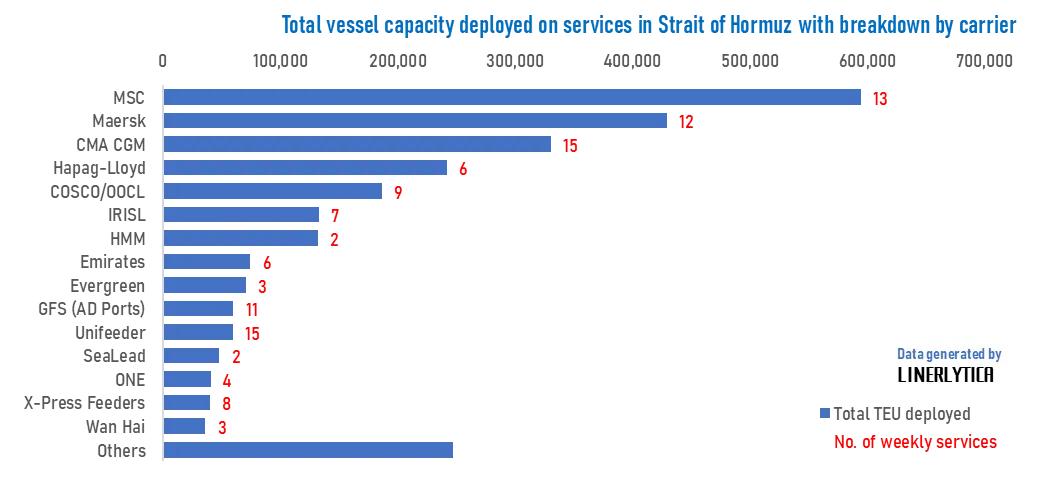
Despite regional instability, the Strait of Hormuz remains open, with CMA CGM and Hapag-Lloyd both confirming normal maritime operations in the area. However, there has been a noticeable rise in GPS signal jamming throughout the Arabian Gulf, disrupting AIS transmissions and complicating vessel navigation.
North America
North America

Ocean rates
The freight rate environment on the TPEB continues to soften across all gateways:
- West Coast floating rates have nearly converged with fixed-rate levels, reducing volatility and offering more predictable cost planning for shippers.
- East Coast and Gulf Coast rates are now falling due to the mismatch between capacity and demand. These reductions are expected to continue into July.
- The General Rate Increase (GRI) for June 15 has been fully withdrawn across all U.S. coasts.
- The Peak Season Surcharge (PSS) for June 15 is also being rolled back, especially for West Coast lanes where FAK (Freight All Kinds) rates are nearing contract levels. PSS on the East Coast remains comparatively elevated, but is also showing signs of downward adjustment.
Shanghai → New York
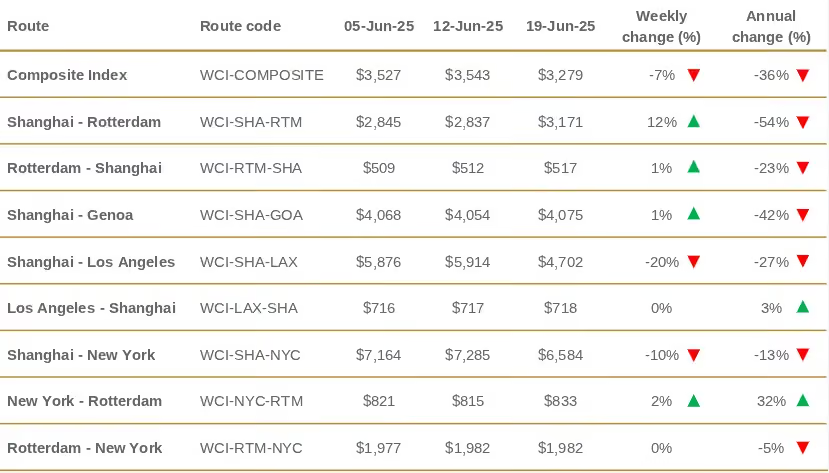
Rates dropped 10% week-over-week to USD $6,584 per 40 ft container, but remain about 81% higher compared to six weeks ago.
Shanghai → Los Angeles
Freight costs fell sharply, by 20% week-over-week. However, overall, they’re still up 73% compared to six weeks prior. Source: Drewry
After several weeks of steady gains, the SCFI has retraced its recent progress, as transpacific spot rates came under intense pressure from mounting excess capacity. Rates to the U.S. West Coast have seen their sharpest weekly declines in the past fortnight, with carriers unable to hold onto the rate increases introduced on 1 June. This has also raised concerns about the viability of peak season surcharges for contract customers. Although the early tapering of the transpacific peak season has yet to impact secondary trade lanes—where volumes remain strong—signs of softening are beginning to emerge. Charter rates have held firm for now due to limited vessel availability, but forward freight futures for August on the East Coast are already trading below June levels. This suggests the market may have reached its ceiling for 2025, with potential downward corrections on the horizon. Source: Linerlytica
Capacity
The Trans-Pacific market is entering a transitional phase following an early peak season for some shippers. While overall demand has not significantly declined, bookings for July are noticeably slower compared to the strong volumes seen in late May and early June.
Capacity across the trade is stabilizing between 85%–90% utilisation, particularly from mid-June onward. However, the Pacific Southwest gateway is nearing full capacity, largely driven by the introduction of extra loaders. This surge has begun to tip the balance toward overcapacity, especially as demand remains uneven and closely tied to individual shipper strategies and cargo profiles.
- Blank sailings are trending down: Week 26 projections show a 7% cancellation rate, dropping to 6% in Week 27 — signaling a move by carriers to stabilise capacity alignment.
- Equipment availability remains broadly sufficient across key TPEB origins, with no major shortages reported.
Schedule Reliability
With fewer blank sailings and sufficient equipment at origin, schedule reliability is improving modestly, particularly on core direct services to the Pacific Southwest. However, the risk of port congestion remains if excess capacity persists into July.
US Tariffs
Key updates (as at 23 June 2025):
- Steel & aluminium tariffs locked in at 50% – appliances and household goods now included
- 25% tariffs on autos and parts remain in effect – exemptions only for USMCA-compliant imports
- 10% universal tariff reinstated – legally upheld after brief court pause
- China: layered tariffs persist despite partial 90-day truce – most duties remain active
- 120% tariff on low-value e-commerce imports from China (<$800) – up from 90%, hitting logistics
- U.S.–U.K. deal offers tariff relief – phased reductions on cars, aerospace, steel/aluminium
- South Korea and India in talks – pushing for carve-outs and tariff stability
- Tariff burden rising – average U.S. tariff rate now ~15–18%; driving up costs and inflation
👉 Read the full update in our Dedicated Tariffs Blog.
Europe
Europe
.png)
Ocean freight rates
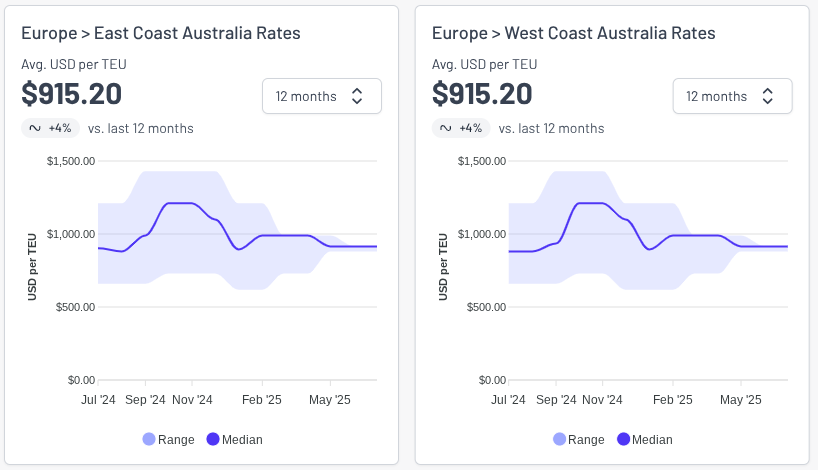
Rates on the FEWB lane have risen sharply:
- The Shanghai Containerized Freight Index (SCFI) has jumped 60% over the past six weeks, reflecting tightening capacity and increasing demand.
- General Rate Increases (GRIs) are already being announced for July, with CMA taking the lead. More carriers are expected to follow.
Given the rate trajectory and full vessel bookings:
- Shippers are strongly advised to book at least 3 weeks in advance.
- Cargo rollovers are growing more common, with particular impact expected for sailings between late June and early July.
Shanghai → Rotterdam
Rates rose 12% week-over-week, reaching approximately USD $3,171 per 40 ft container.
Shanghai → Genoa
Slight weekly increase of 1%, with rates at approximately USD $4,075 per 40 ft container. Source: Drewry
The TAWB rate environment remains relatively calm, with most carriers delaying the introduction of further surcharges:Overall, freight rates remain stable, with no major fluctuations expected until after the first week of July, when seasonal volumes could trigger minor upward adjustments.
- North Europe: Carriers have postponed the application of Peak Season Surcharges (PSS) until July, despite moderate demand levels.
- West Mediterranean: One carrier is pursuing a limited PSS implementation during the final week of June, though most have delayed changes until July.
- East Mediterranean: Carriers continue to defer PSS rollouts, with some now postponing implementation indefinitely pending clearer demand signals.
Overall, freight rates remain stable, with no major fluctuations expected until after the first week of July, when seasonal volumes could trigger minor upward adjustments.
Capacity and schedule reliability

Capacity
The FEWB trade is facing mounting pressure from a combination of equipment challenges, infrastructure disruption, and early-season demand surges:
- Container availability remains tight, particularly as carriers depend on empties repositioned from Trans-Pacific return voyages.
- Inland congestion in Germany and Belgium is worsening:
- Rail disruptions in Germany are delaying container movement.
- Low water levels in the Rhine are causing barges to wait upwards of 56 hours, straining inland logistics.
- Strikes at Antwerp (June 25) and Gothenburg (June 23–24) are expected to exacerbate backlogs.
From a geopolitical standpoint, tensions near the Strait of Hormuz have limited direct impact on FEWB container flows. Most carriers have already rerouted via the Cape of Good Hope, avoiding the Red Sea entirely. However, any escalation impacting oil shipping could influence bunker fuel surcharges (BAF) downstream.
Conditions across the TAWB trade are relatively stable, with some improvements in European port congestion.
- Northern Europe: Most major ports have seen an improvement in terminal congestion, though Antwerp continues to face delays and operational challenges.
- Mediterranean Region: Port congestion remains an issue in key hubs, particularly in Piraeus, as well as at major Italian (Genoa) and Spanish (Valencia and Algeciras) ports. These bottlenecks are contributing to minor delays in vessel schedules and equipment repositioning.
Despite the congestion in southern Europe, overall demand remains steady, and vessel capacity is sufficient to meet shipper needs. Carriers are adjusting schedules with minor blank sailings, but space remains largely accessible with standard lead times.
Equipment availability continues to be a mixed picture across the TAWB network. Shortages remain critical in inland Central Europe, particularly:
- Austria, Slovakia, Switzerland, Hungary, and parts of Southern and Eastern Germany.
- Shippers are encouraged to opt for carrier haulage at these origins to ensure timely container pickup and reduce delays.
Main North European ports currently report stable inventory levels with no significant container shortages.
Portuguese ports — notably Lisbon and Leixões — are experiencing equipment tightness, along with Mersin in southern Turkey, impacting load planning from these regions.
Carriers are actively repositioning equipment where possible, but inland shortages are likely to persist through early July due to rail congestion and uneven cargo flows.
Schedule reliability
FEWB service reliability is under strain:
- Port congestion and inland delays are causing significant downstream delivery issues.
- Schedule disruptions are likely to persist through early July due to industrial actions and infrastructure bottlenecks.
While weather-related and labor disruptions are minimal at present, port congestion in key Mediterranean hubs may cause modest delays in vessel turnaround and feeder operations. However, carriers have largely kept weekly services intact, and schedule reliability has improved slightly across Northern Europe.
Global air freight
Middle East & South Asia (MESA) airfreight volumes remain approximately 13% below the previous two-week average:China & Hong Kong → United States volumes fell 10% WoW (week 23), now 19% lower YoY, with similar downward pressure on spot rates (–5% WoW, –17% YoY).Reason:
The early-month rebound, created by deferred shipments after tariff relief, appears to have been temporary rather than sustained.
- Lower China–US trade volumes
- Holiday-related slowdowns (Vakbd Month Eid, South Korea Memorial Day, Pentecost in Europe)
Global air cargo tonnage dropped 3% WoW in week 23, driven by:Year-on-year, total volumes are down 2%, based on over 500,000 weekly transactions
- Inbound tonnage to Asia Pacific is down 14%, and to Europe down 11%
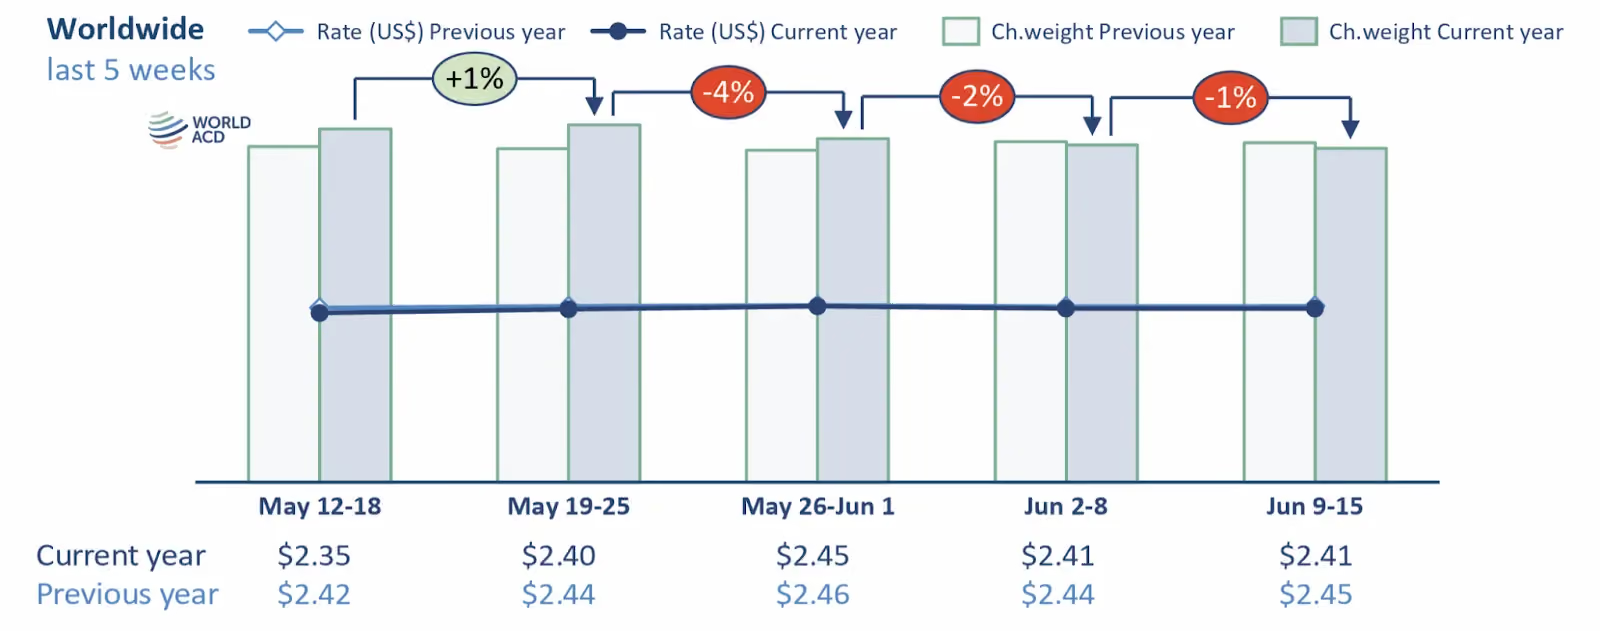
Rate Stabilisation Amid Volume Softness
- Global average rates held firm at US$2.44/kg, unchanged YoY from last year’s week 23
- Spot rates edged up 2% WoW to $2.63/kg, marking a 1% YoY gain
- Notable drop in China–US spot rates (–12% WoW), results of new “de minimis” import rules introducing elevated costs for lower‐value parcels
- Rates from MESA origin reduced by ~16% YoY, reflecting inflated levels last year
Comparing weeks 23–24 vs. weeks 21–22 shows a modest 1% increase in both global volumes and average rates.
Week 24 figures indicate total tonnage dipped 2% WoW, but rates remained stable at US$2.51/kg, 8% higher YoY and 42% above June 2019 levels.
What to Watch
- Holiday and tariff-linked volume rebounds, particularly into midsummer.
- New “de minimis” regulations and their influence on low-value parcel airfreight.
- Region-specific developments (e.g., post-Eid recovery, equipment/logistics disruptions) that may shift short-term supply/demand balances. Source: World ACD
Airfreight capacity from China to Australia is currently more stable compared to previous weeks, with some carriers reducing rates on selected routes. However, space remains tight across major airports, particularly ahead of 27–28 June, where flights to SYD, MEL, and BNE were fully booked.
- China Eastern (MU): Capacity continues to be impacted by strong e-commerce volumes and passenger baggage. High demand is affecting overall space availability to Australia.
- Juneyao Airlines (HO): Offers service to BNE, ADL, and PER, typically via truck transfers from SYD or MEL. Cargo details are required to confirm availability and rate options.
- ANA (NH): Space to SYD is fully booked through 28 June. Bookings are handled case-by-case depending on cargo specifications.
- Japan Airlines (JL): Currently offering competitive rates, but with extended transit times (7+ days). Suitable for non-urgent cargo with flexible delivery requirements.
- China Southern (CZ): Recommended for dense cargo from Shanghai to Sydney, with weekly consolidated service and stable space allocation. Pre-alert documentation is provided upon customs clearance at CAN.
Overall, while there is some rate relief, tight capacity driven by e-commerce demand continues to require early planning and flexible service selection for shipments into Australia.
Global shipping overview
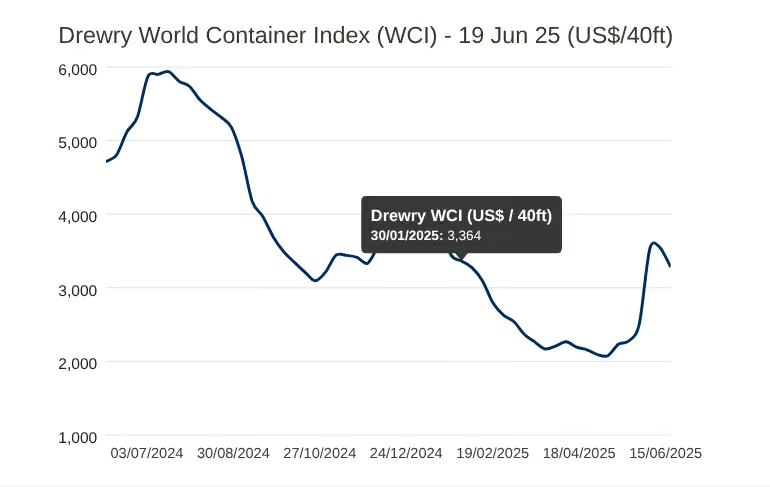
In April 2025, global schedule reliability rose to 58.7% — a 1.7% month-on-month improvement and the strongest performance since November 2023. Compared to the same time last year, reliability was up by 6.5 percentage points. Among the top 13 carriers, Maersk led the way with a reliability rate of 73.4%, followed by Hapag-Lloyd at 72.3% and MSC at 60.7%.Drewry’s WCI recorded a 7% decline, bringing the global average to USD $3,279 per 40 ft container.
General news
A surge in geopolitical risk linked to the Israel–Iran conflict has triggered sharp increases in freight and tanker markets:
- Very Large Crude Carrier (VLCC) rates nearly doubled, rising from around $25,000 per day to almost $55,000/day within a week. These vessels, crucial to oil transport, are heavily exposed to Middle East shipping lanes.
- Long Range 2 (LR2) tanker rates have also spiked, topping $45,000/day—these levels were last seen in July 2024.
- Around 60–65% of global VLCC and LR2 shipments operate in the Gulf region, making these assets especially sensitive to regional instability.
- The market response reflects shipowners avoiding high‑risk routes, especially near the Strait of Hormuz amid threats like mining.
Additionally:
- Oil prices have rallied—Brent crude rose ~20% in June, driven by supply concerns amid the uncertainty.
- Surge in insurance and war risk premiums due to elevated threat perceptions, further inflating freight costs. Source: Splash 247
Tensions in the Middle East have escalated following U.S. airstrikes on Iranian nuclear sites, prompting Iran to threaten closure of the Strait of Hormuz - a vital global shipping route that carries nearly 20% of the world’s oil. As a result, global shipping is on high alert, with tankers rerouting, freight and insurance rates spiking, and carriers like CMA CGM and Hapag-Lloyd closely monitoring developments. Supertankers have already reversed course in the Gulf, and Japanese carriers are advising ships to minimize time in the region. While ports remain open and traffic is flowing, increased GPS jamming and security threats - such as drone, mine, or missile attacks - pose growing risks to navigation and commercial vessel safety. Source: G Captain
Recent tensions around the Strait of Hormuz have sparked concerns over Australian fuel security. Despite Iranian threats to close the strategic waterway following recent strikes on its nuclear facilities, the shipping industry remains confident that it will stay open. Shipping Australia points to historical precedent - during the Iran–Iraq Tanker War (1980–1988), Hormuz never closed - even amid direct targeting of commercial vessels With approximately 20% of global oil and LNG volumes transiting the strait daily, even the threat of disruption caused Brent crude to briefly jump from US$69 to US$74 per barrel on June 13. For Australia, this escalation continues to raise questions about fuel price volatility and supply chain resilience. Source: The DCN / Linerlytica
Interesting Articles
- Container barge grounds off Singapore beach resort
- Antwerp terminals at the end of their tether amid congestion woes
- Europe’s Steel Industry in Jeopardy, Says ThyssenKrupp Exec
- FedEx Founder Fred Smith Dies at 80
- In an Uncertain World, High-Value Freight Needs a New Kind of Care
- APAC delivery giant Shippit releases Insights delivery platform
- Pilbara Ports invests in Australia’s first ‘clean’ fuel hub
- Port of Brisbane unveils Vision 2060 with future roadmap
- Transpacific peak season may already be over, as US inventories decline
.avif)
Experienced Business Development Manager with a demonstrated history of working in the logistics and supply chain industry. Skilled in Import/Export, Freight Transportation, Freight, Warehouse Operations, and Overseas Networking.
Frequently Asked Questions
Explorate gives supply chain managers one real-time view across ever forwarder, lane and mode without replacing your current process, partners or systems.

