
.avif)
Australia
Australia

Brisbane
Patrick Terminal (Fisherman Islands) will shut down all yard and vessel operations from 07:00 to 23:00 on Tuesday, 22 July, for scheduled infrastructure and system maintenance. Delays of 1-2 days are expected.
Sydney
We can expect delays of up to 2 days due to minimal port congestion. There is a shortage of 20’ equipment.
Melbourne
Delays of up to 2 days can be expected. There is also a shortage of 20’ equipment.
Fremantle
The Bureau of Meteorology has issued a severe weather warning for Perth metro and the south-west, forecasting damaging wind gusts exceeding 100 km/h, heavy rainfall, and a risk of flash flooding. This is impacting berthing schedules and delaying container operations.
North East Asia
North East Asia

- The Asia-Pacific market is messy right now, and space remains a challenge across the board. Penang is still a headache. Ex-China space is tight, with A3 services seeing around a week’s delay just to secure a booking. Vessel delays arriving into China are also pushing ETDs out, so planning has become a moving target.
- Vietnam, especially Haiphong, isn’t faring much better. We’re seeing bookings confirmed and then last-minute vessel delays come through, throwing things off track. Transhipment hubs like Singapore and Port Klang are still unreliable - vessel delays with no solid information, and often, no assigned transhipment vessel at all. That makes giving clients a realistic ETA tricky. We're constantly monitoring schedules daily, just to keep updates accurate.
- On the carrier side, many have pulled back their earlier rate increases as pressure mounts from the flood of large vessels scheduled later this month. Those without solid long-term contract support are feeling it most. There’s been a round of downward adjustments to stimulate volume, especially out of South China ports like Shenzhen and the Pearl River Delta. Northern ports, like Dalian and Tianjin, remain more stable, but space is limited, so they’re less volatile right now.
- Looking ahead to August, we’re definitely heading into the true peak season. Early signs point to rates increasing again, and while some of the published numbers seem ambitious, rate hikes are expected. We’ll have a clearer picture in the coming week.
Ocean freight rates

Rate summary: 25th July - 31st July 2025
As the market continues to shift in response to competitive pressures and vessel congestion, several alliances and service groups have announced revised freight rates for the final week of July. Please see a summary of the latest adjustments below:
Most Competitive Services: Carriers operating under CAT and CA2 have issued updated rate guidance between USD1050.00 - 1150.00 per TEU. Notably, rates from Shenzhen, which had previously held steady, are also being lowered, partly to shift volume south, given softer demand and space constraints in the north. These Shenzhen-related changes take effect from 25th July.
Mid-Tier Services: This pricing shift has triggered broader market alignment. The NEAX (A1X) service has responded by adjusting their rates for late-July sailings from key ports to USD 1150.00 per TEU. PANDA and WALLBY services have followed with matching levels of USD 1100.00 per TEU across Qingdao, Shanghai, Ningbo, Shenzhen, and Nansha.
Premium Services: The A3 consortium has increased rates to USD1350 - 1450.00 per TEU, amid the popularity of their direct services. PSS will apply to shipments from the 1st August.
Advertised GRIs/PSS:
- ANL: USD350.00 per TEU Peak Season Surcharge (PSS) for all shipments effective 1st August 2025, ex North & South East Asia to New Zealand.
- ANL: USD500.00 per TEU Rate Restoration (GRI) for all shipments effective 15th August 2025, ex Asia, Indian Sub-Continent & Middle East to Australia.
Capacity and schedule reliability

Capacity
China
- CAE: Two blank sailings in August, leaving only one departure in the first half and one in the second half of the month. Space availability has been reduced by approximately 50%.
- CAT: Similarly, two blank sailings are scheduled in August, mirroring CAE’s pattern with a 50% space reduction.
- ZAX: One blank sailing planned for mid-August.
- Wallaby: One blank sailing expected in early August.
Southeast Asia
- Booking delays ex Vietnam and Malaysia. Vessels full and/or rolling.
- Departing from TAO or SHA
Schedule Reliability
China:
- Shanghai: Vessels are facing 2-3 day delays at the YS terminal, and 1.5-2 days at WGQ and Ningbo.
- Qingdao: Expect waiting times of up to 2 days, with 37 vessels already queuing.
- Xiamen: Heavy fog forced a 7-hour closure last week, pushing out average wait times further.
- Southern China is still reeling from the impacts of Typhoon Wipha, which made landfall late Sunday and brought powerful storms across the region on Monday, July 21.
- Guangdong province (cities like Yangjiang, Zhanjiang, and Maoming) was hit with heavy rainfall, prompting flash flood and landslide warnings after Wipha weakened to a tropical storm upon reaching land. In Hong Kong, the typhoon uprooted trees, damaged scaffolding, grounded flights and forced nearly 280 people into shelters. Winds peaked above 167 km/h and over 110 mm of rain fell in just three hours. Falling to tropical-storm strength, Wipha is now moving southwest along the coast toward Vietnam, expected to gain strength over the Gulf of Tonkin before making landfall in northern Vietnam.
Vietnam has issued emergency alerts for coastal provinces and initiated evacuations. Government and airlines have scrambled to secure infrastructure and cancel flights, preparing for potential floods and landslides. Source: Reuters - This has significantly disrupted transportation across the region. From 11 AM on July 19, all major container terminals - including those in Yantian, Shekou, Dachan Bay, Nansha, and Hong Kong - halted gate operations for container pickups and deliveries. Road closures and widespread flight cancellations added to the chaos. While the typhoon warning was lifted early on July 21 and full operations have since resumed, the resulting backlog of cargo and orders is expected to cause continued delays and congestion throughout week 30.
Vietnam
- Ho Chi Minh & Haiphong: High berth and yard utilisation. Carriers are reporting delays of up to 1 day. Yards are sitting at 80-90% capacity, which is beginning to affect productivity.
Malaysia:
- Port Klang: Berth congestion and vessel bunching are ongoing. Yard utilisation is high, sitting around 85-90%.
- Penang: Space is tight, with delays in securing bookings.
Singapore:
- Consistent delays for transshipment vessels. There is a lack of visibility on carrier tracking sites to clearly demonstrate where delays are taking place.
Maersk: Due to an operational scheduling adjustment, CONTI ANNAPURNA 529S/532N will omit Sydney to mitigate delays to the forward schedule. Source: Maersk
South East Asia
South East Asia
.avif)
Ocean freight rates

Rates out of Southeast Asia have remained stable for the second half of July. We are currently awaiting rates for August, but we can expect increases that align with the GRI/PSS notices we are receiving from carriers.
Capacity and schedule reliability

Booking delays ex Vietnam and Malaysia. Vessels full and/or rolling.
India Subcontinent
India Subcontinent
.png)
- Chittagong is currently under heavy pressure, with severe yard congestion and long vessel waiting times. Landside operations are struggling to keep up due to the sheer volume of containers moving through the port. Earlier this week, over 20 vessels were anchored offshore, with waiting times stretching from 6 to 9 days just to berth. Once alongside, vessels are averaging 3-4 days in port.
- CFS operations are also heavily impacted, with ongoing delays to both loading and unloading. A shortage of locomotives is creating major backlogs - Dhaka ICD-bound imports are seeing dwell times of 20-22 days for 20' containers and up to 23 days for 40'. For cargo headed to Pangaon, dwell times have now increased to 1-2 weeks.
- To make things more challenging, another low-pressure weather system is forecast to affect Chittagong, Cox’s Bazar, Mongla, and Payra. Authorities have issued Cautionary Signal No. 3, indicating potential further disruptions to port activity.
North America
North America

Ocean rates
- TPEB - West Coast: Mixed bag - some carriers pushed July 15 GRIs, while others held steady or offered one-off (or fixed price) rates, creating a wider gap in pricing.
- East Coast & Gulf: Rates here are more stable - floating rates and Peak Season Surcharges (PSS) have been softened for the rest of July.
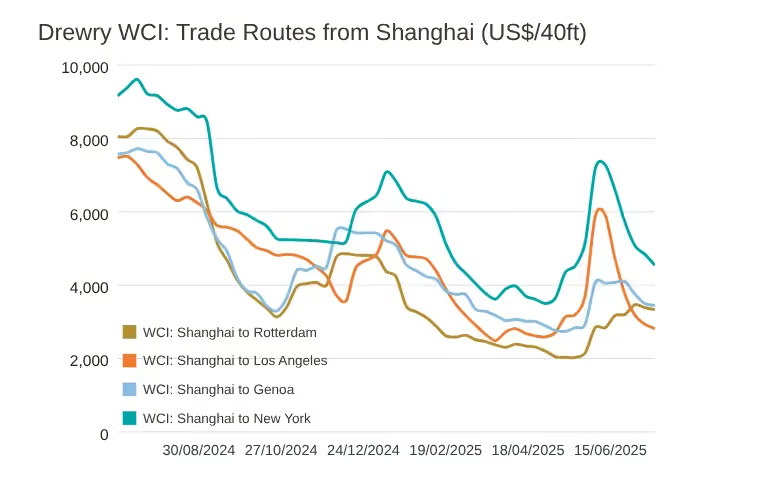
- Transpacific spot rates declined this week, with Shanghai–Los Angeles down 4% to $2,817 per FEU, and Shanghai–New York dropping 6% to $4,539 per FEU. Despite the weekly dip, rates on both routes remain elevated compared to 10 weeks ago, when tariff concerns first began pushing prices up. Spot rates to Los Angeles are still 4% higher, while rates to New York are up a significant 24% since 8 May. However, Drewry expects these rates to continue falling due to softening demand. Looking ahead to the second half of 2025, the supply-demand balance is projected to weaken further, likely putting more downward pressure on rates. The pace and severity of future changes will depend heavily on the implementation of potential new Trump-era tariffs and any capacity shifts triggered by U.S. penalties on Chinese vessels—both of which remain uncertain. Source: Drewry
Advertised GRIs:
- Maersk: Peak Season Surcharge (PSS) of USD1600.00 per container ex North West India/Nepal/ Bhutan/ Pakistan/United Arab Emirates/Yemen /Oman/ Iraq/Kuwait / Jordan/ Saudi Arabia/Qatar/Bahrain to US and Canadian East & Gulf Coast. Effective from the 16th August 2025.
- Maersk: Peak Season Surcharge (PSS) of USD3000.00 per 20’ and USD2500.00 per 40’ ex South & East India, Sri Lanka, Bangladesh, and Maldives to US and Canadian East & Gulf Coast. Effective from the 16th August 2025.
Capacity
On the TPEB trade demand is steady and expected to stay flat through August.
Carriers are running at 80–90% capacity in July, dropping slightly to 75–86% in August.
Even with some suspended services and blank sailings (especially to the Pacific Southwest), the market is still dealing with more space than needed.
Space is open across most lanes.
Equipment availability is stable at origin ports - no major issues flagged.
Shrinking drayage demand amid a recession-like environment is causing smaller U.S. port trucking operators to collapse, reshaping the industry's competitive landscape toward fewer, larger players.
Retailers and manufacturers have accelerated shipments (“front‑loaded”) in response to tariff uncertainties, clearing inventories well ahead of the usual second‑half surge
As a result, demand on major deep‑sea container and airfreight lanes is showing signs of tapering off, rather than building into the traditional late-year peak
Carriers, anticipating this downturn, are proactively adjusting capacity to stave off rate erosion, reducing sailings and freighter space to support spot rates. Consequently, the classic H2 "peak season" pattern - where volumes climb into Q3 and Q4 - is now unlikely to materialize in 2025.
Bottom line: The early shipment rush has effectively flattened what would’ve been the usual late-year peak in global logistics, forcing carriers to scale back and reshaping freight demand dynamics for the rest of 2025. Source: The Loadstar
Schedule Reliability
- Long Beach/LAX: Up to 5 days delay at the terminal, with an additional rail dwell of up to 7 days.
- Prince Rupert: Up to 7 days delay at the port.
- Vancouver: Up to 5 days delay at the port.
- Montreal: Up to 5 days delay at the port.
- Savannah: Up to a week's delay at the port, with a vessel dwell time of 5-6 days.
- Houston: Up to 5 days delay at the port, with a vessel dwell time of 4 days.
- Miami: Up to 5 days delay at the port.
US Tariffs
Key updates (as at 23 July 2025):
- Major tariff hikes proposed on Canada, Mexico, EU, Vietnam and BRICS nations
- Pharma & copper facing huge increases (up to 200% and 50%)
- Transshipped goods won’t escape the new rates
- China’s 10% tariff stays (for now)
- August 1 is the key deadline – negotiations still underway
👉 Tariff hikes, trade tensions, and shifting supply chains – read the full breakdown
Europe
Europe
.png)
Ocean freight rates
TAWB: Carriers have hit the pause button on Peak Season Surcharges (PSSs) across Northern Europe, the West Med, and East Med, with no new increases expected through the end of Q3. Rates across the board remain stable for now.
FEWB: Freight rates have stabilised after the strong rebound in June. The latest Shanghai Containerized Freight Index (SCFI) sits at $2,099/TEU, showing only a minimal dip of $2/TEU. This signals that the market is levelling out, and carriers may struggle to push through further GRIs in the second half of July.
Advertised GRIs:
Maersk: Peak Season Surcharge (PSS) of USD250.00 per TEU ex Far East Asia to North Europe. Effective from the 1st August 2025.
FEWB: August FAK levels are holding firmer, sitting around 5–8% higher than the back half of July. With vessel utilization already running high in early August, rates have some upward pressure, especially as we move towards September. The Shanghai Containerized Freight Index is showing signs of climbing, and with Maersk’s recent PSS announcement on long-term deals, other carriers are beginning to shift their surcharges in anticipation of peak season demand.
TAWB: Carriers in Northern Europe and the West Mediterranean have held off on the PSSs that were planned for July, keeping rates stable for now. This steady pricing trend is expected to carry through the end of Q3. In the East Mediterranean, some carriers are starting to roll out GRIs for September, hinting at potential movement as we approach the next quarter.
Capacity and schedule reliability

Capacity
TAWB: Congestion continues to be a challenge, with PSA Antwerp seeing dwell times stretch to eight days. Ports like Hamburg, Bremerhaven, and Rotterdam are experiencing vessel delays of up to three to four days. Southern ports such as Piraeus, Genoa, and Valencia are still battling heavy congestion and yard overflow issues. Despite these operational pressures, export demand from Northern Europe to the U.S. remains steady, with a noticeable pre-holiday spike in bookings coming out of Germany, the Benelux region, and Spain. Only about 5% of sailings are currently blanked - the lowest percentage we've seen since March - so overall, capacity is holding firm.
FEWB: Peak season is officially in full swing, with weekly capacity in July hitting over 300,000 TEUs, up 19% compared to June. Despite the ramp-up, blank sailings in Week 29 have led to significant backlogs, and carriers are now focused on clearing this congestion over the next one to two weeks. Demand has not only rebounded, it’s exceeding carrier expectations, steadily climbing since June. Vessel delays and rollovers are already pushing shipment windows for Black Friday and Christmas, which could mean an extended peak season well into the back half of the year.
Schedule reliability
While the major ports are strained, the overall network is still functioning. That said, equipment imbalances continue to affect inland hubs. Exporters in Austria, Slovakia, Hungary, and parts of Southern and Eastern Germany are still facing shortages of containers and chassis. Portugal is also dealing with limited container availability due to imbalanced returns.
On the FEWB trade, rollovers, vessel bunching, and tight controls on equipment remain front and centre. Some carriers, like Gemini, have added extra loader vessels mid-month, but alternate routing options could add two to four weeks to transit times. Meanwhile, Ocean Alliance (OA) and Premier Alliance (PA) are tightening their policies on new bookings for Weeks 31 and 32, with compressed container release and booking windows across the board. Expect these tight conditions to linger into late July or early August.
Security concerns are again impacting global routing. With renewed Houthi attacks in the Red Sea, carriers are steering clear of the region for now, likely for the next month or two. Additionally, the proposed 30% tariff on EU goods by former President Trump (slated for August 1) could disrupt European manufacturing and drag on Asia-Europe demand. That said, because Asia-Europe trade remains heavily consumer-driven, any impacts may be softened during the core peak season.
Belgium
- Antwerp is under mounting pressure, with container volumes rising 3.7% in H1 2025 to 6.91 million TEUs. While this growth reflects strong trade flows, it’s adding significant strain to capacity amid already challenging market conditions. Congestion is being driven by multiple compounding issues: irregular vessel arrivals stemming from Red Sea diversions, ongoing alliance reshuffles causing vessel bunching, and continued poor schedule reliability. As a result, container dwell times are now averaging 7–8 days (up from the usual 5), and terminal yards are overutilised, leading to excess container moves and higher pressure on labour and equipment. Multiple strike actions earlier this year have only added to the operational stress. On the waterside, congestion has eased slightly with limited vessel waiting times. However, landside performance remains critically impacted.
Germany
- Hamburg has announced a €1.1 billion infrastructure upgrade focused on modernising container terminals and widening the Waltershofer Hafen turning basin (from 480m to 600m) to better handle large vessels. Source: Offshore Energy
- Operationally, all major terminals are congested. Berthing lines are full, and late arrivals must wait. Yard density is high, with gate-in restrictions still in place. Labour shortages will likely persist through September. Rail delays are significant due to ongoing construction, infrastructure challenges, strike backlogs, and increased volumes.
Netherlands
- Rotterdam remains under strain, with all major terminals reporting high yard utilisation and vessel delays.
Italy
- Genoa: Congestion continues, with some vessels facing waiting times of up to 3 days. Yard density is currently 86%, and several vessels were anchored at the time of update. Some carriers are omitting Genoa calls to avoid delays due to the infrastructure works by the Italian Rail Network. They are suspending rail services to/from Genoa port.
Spain
- Algeciras: Yard density is around 83%, with a full berthing lineup. The port is prioritising heavy export vessels to manage yard flow. Some carriers are experiencing 2-day berth waits.
- Barcelona: Vessel waiting times have increased to an average of 7 days. Yard density is currently 71%. Two vessels were anchored at the time of reporting.
- Valencia: Conditions have worsened, with waiting vessels increasing to 13. Yard utilisation is now at 85%.
United Kingdom
- London Gateway: Ongoing power and system outages are limiting productivity. Empty stock sits at 1,204 TEUs. Terminal dredging works are underway.
- Southampton: The terminal is running at 90% capacity, with reefer slots at 85% utilisation.
Global air freight
Drewry’s World Container Index (WCI) dropped another 2.6% this week, marking the fifth straight week of declines. This sustained downturn follows a volatile period sparked by higher U.S. tariffs announced back in April. Rates began climbing about a month later, peaking in early June. But that surge didn’t last—since mid-June, rates have been steadily falling, suggesting the initial impact of the tariffs has now faded. Source: Drewry
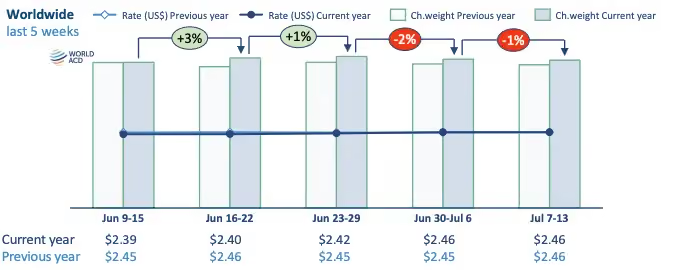
One of the standout shifts in Week 28 was the second week in a row of falling export volumes from Asia Pacific to the U.S., with tonnages dropping another 5% week-on-week. The dip was mostly driven by Southeast Asia, where we saw sharp double-digit drops from Indonesia (-23%), Thailand (-21%), Vietnam (-14%), and Singapore (-10%). All of these markets had already started sliding the week before, except Thailand, which had seen a brief +2% uptick in Week 27.
On the flip side, there were a few bright spots. Volumes out of Japan bounced back by +6%, Hong Kong edged up +3%, and South Korea held steady with a +1% lift. Taiwan and China both slipped by -3% week-on-week. Rates from Asia Pacific to the U.S. also took a hit, down 2% overall, driven by a steep 20% drop in spot pricing out of Japan, and smaller reductions from Thailand, Malaysia, and Singapore.
In contrast, Asia Pacific to Europe remained fairly stable, up 1% WoW. Most markets saw slight gains, with South Korea and Malaysia leading the way at +7% and +5%, respectively. Taiwan, however, continued its downward trend, posting a 3% drop for the third week in a row. Source: World ACD
- China to Australia: Due to high temperatures and seasonal load restrictions, airfreight capacity has been significantly reduced. Space to Australia is tightening fast, and several airlines have already increased their airfreight rates.
- Starting next week, e-commerce cargo will gradually resume, which is expected to create further fluctuations in both space availability and pricing. Capacity may remain unstable for the foreseeable future.
- MU (China Eastern Airlines): Space to SYD and MEL is fully booked through 26th July. BNE services are experiencing major offloads, with the earliest estimated departure after 30th July. Increased passenger luggage and e-commerce volumes are contributing to limited cargo space and a growing backlog at Shanghai Airport.
- HO (Juneyao Airlines): Operating flights to BNE, ADL, and PER with final-mile delivery via truck from SYD or MEL.
- NH (All Nippon Airways): SYD services are fully booked until 26th July.
- JL (Japan Airlines): Currently offering competitive rates; however, extended transit times (10+ days) due to congestion and limited uplift. Best suited for non-urgent cargo without strict delivery deadlines.
Global shipping overview
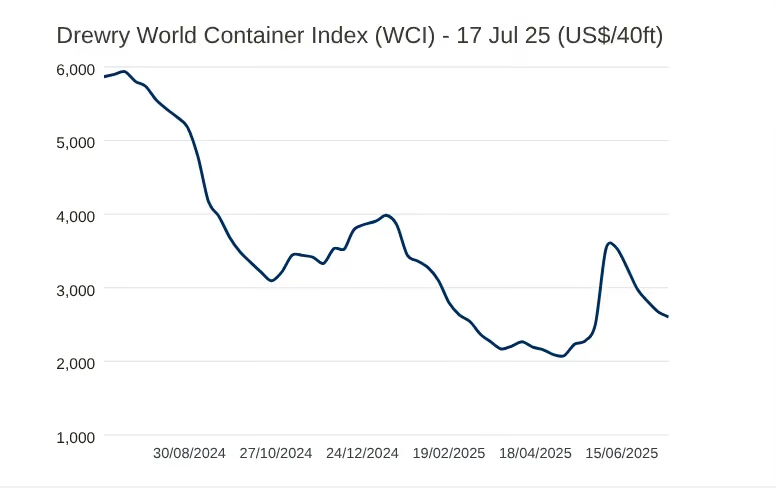
Drewry’s World Container Index (WCI) dropped another 2.6% this week, marking the fifth straight week of declines. This sustained downturn follows a volatile period sparked by higher U.S. tariffs announced back in April. Rates began climbing about a month later, peaking in early June. But that surge didn’t last—since mid-June, rates have been steadily falling, suggesting the initial impact of the tariffs has now faded. Source: Drewry
General news
- Container shipping is being rapidly transformed by a convergence of digital innovation, sustainability imperatives, shifting trade patterns, and port modernization. Carriers are leveraging AI, IoT, digital twins, and blockchain to boost efficiency, optimizing routes, predictive maintenance, and real‑time cargo tracking, while ports are becoming increasingly “smart” with automation and seamless data integration. Environmental regulations and decarbonization targets by the IMO are driving adoption of green fuels (like LNG, hydrogen, ammonia), wind-assisted propulsion, hybrid vessels, and lighter ship designs. Geopolitical dynamics and supply chain regionalization are refinancing trade routes, boosting mid‑sized vessels and regional transshipment hubs over mega-ships. Together, these emerging trends are pushing the industry toward smarter, greener, more resilient operations that adapt better to volatility and evolving global trade. Source: Container News
- The Houston Ship Channel’s Project 11 marks its 11th major expansion and is set to deepen and widen approximately 41 of the channel’s 58 miles. The initiative will expand the Galveston Bay reach from 530 ft to 700 ft, deepen some upstream sections to around 46.5 ft, and widen the Bayport and Barbours Cut channels to about 455 ft.
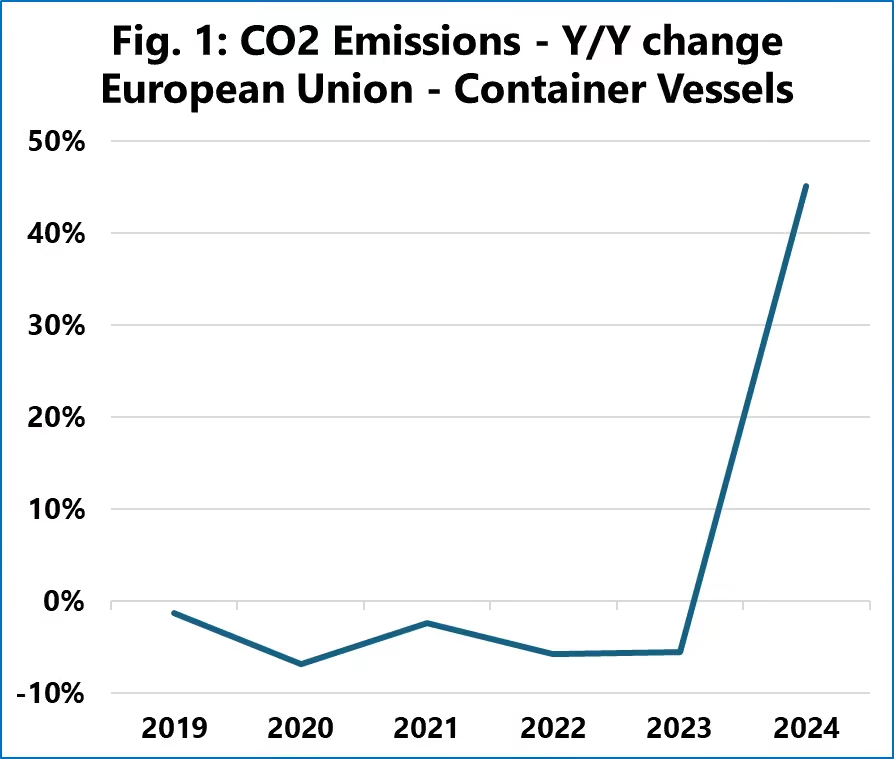
With federal and local backing - including over US $131 million from the U.S. Army Corps of Engineers for FY 25, plus FY 26 funding of $161 million—the project is now ~87% funded, aiming for full completion by 2029. This upgrade allows larger, post-Panamax vessels, boosts port efficiency by reducing daytime navigation restrictions by up to two hours, and cuts shipping costs and emissions by 3–7% annually. Environmental enhancements include using dredged materials to construct bird islands, marshes, and oyster reefs. Economically, Project 11 strengthens Houston’s position as the busiest U.S. waterway, supports 3–3.4 million jobs, and underpins roughly $900 billion in annual trade, enhancing supply chain resilience, energy exports, and regional competitiveness. Source: More Than Shipping - In 2024, container shipping saw a dramatic rebound in CO₂ emissions, reversing years of decline, primarily driven by vessels rerouting around Africa to avoid the Houthi-instigated Red Sea crisis. The rerouting spiked EU container shipping emissions by 45%, contributing to a total rise of 10% across the entire shipping sector, compared to a –4.4% annual reduction seen from 2018 to 2023. Instead of achieving an estimated total of 34.7 MT in 2024, emissions surged to 52.7 MT. This detour adds approximately 18 million tons of extra CO₂, roughly equivalent to Cambodia’s annual emissions. Source: Sea Intelligence
Interesting Articles
- Carrier Rankings By Country Shift In Mid 2025
- Obtaining Space on the Vessels and Deadlines for Obtaining Space on Vessels
- Tariffs Drive 'Market Recalibration' at Port of Oakland in June
- 'Uncertainty Reigns' at U.S. Ports as Retailers Navigate Tariff Turmoil
- Trump’s tariffs: Tracking the status of international trade actions
.avif)
Experienced Business Development Manager with a demonstrated history of working in the logistics and supply chain industry. Skilled in Import/Export, Freight Transportation, Freight, Warehouse Operations, and Overseas Networking.
Frequently Asked Questions
Explorate gives supply chain managers one real-time view across ever forwarder, lane and mode without replacing your current process, partners or systems.

