

What is container tracking and how it really works
If you move freight from factory to water to shelf, you know this: containers rarely disappear. The information does, especially when you track sea freight across multiple carriers and ports.
Ships slip, terminals change cut-offs, holds land late, and fees arrive weeks after delivery. The problem is not just delays. It is not having one trusted view of each container’s lifecycle, and knowing which ones need attention today.
This article is for importers and exporters working with multiple forwarders and carriers. It explains container tracking end to end, from empty release to empty return, why portals and spreadsheets break at scale, and how to shift to real-time, carrier-agnostic tracking with less manual chasing.
Container tracking 101
When managing sea freight across multiple carriers and forwarders, supply chain operations generally fall into one of three distinct worlds: the manual chaos of Spreadsheet Hell, a reactive Forwarder-Driven setup, or the proactive visibility of a Real-Time Platform. Understanding the differences between these three approaches is crucial for determining how efficiently your team can mitigate delays and avoid unexpected fees.
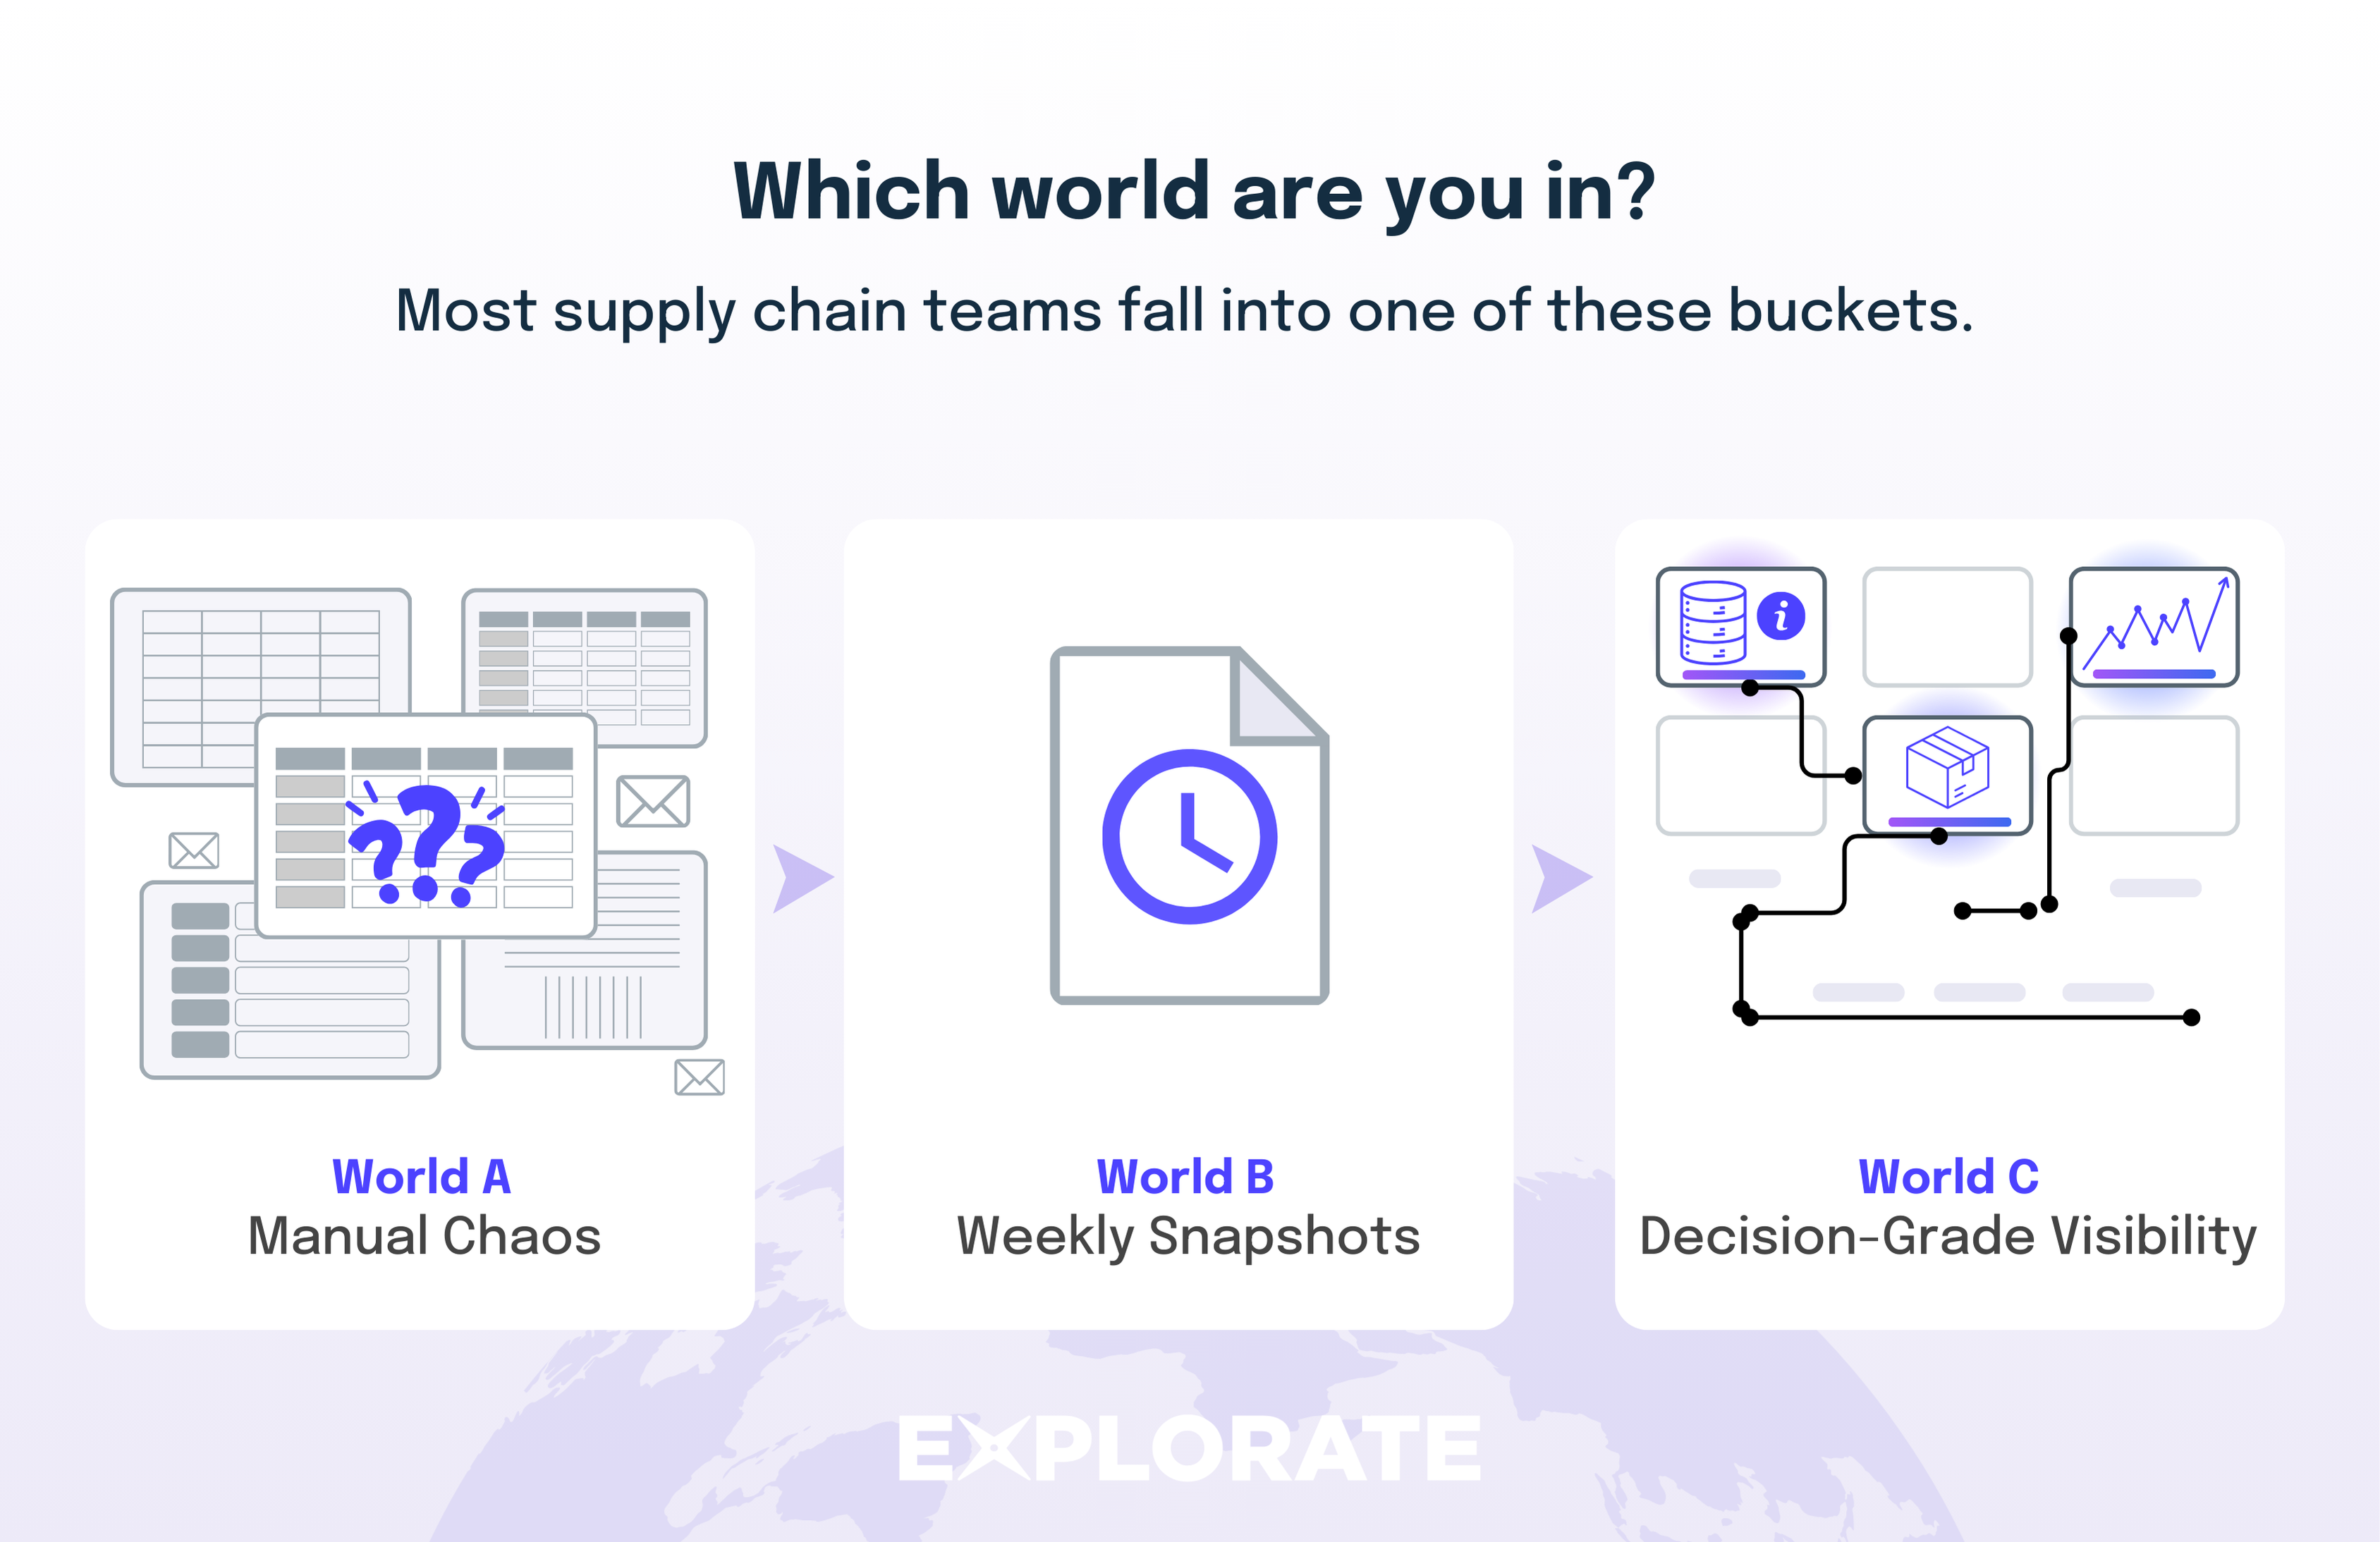
Identifying which world your logistics operations currently inhabit is only the first step. To truly understand how your choice of tracking impacts your daily workload and bottom line, it is essential to look beneath the surface.
A real-time platform like Explorate is essentially a shipping container tracker that lets you track container numbers and exceptions in one place instead of running a container search across a dozen portals.
Figuring out which bucket you fall into:
- Count how many places you look to answer: “Where are my containers?”
- Check how often you get surprised by
- rolled containers
- customs/biosecurity holds
- demurrage/detention or wharf storage
- rolled containers
Are you in World A, B, or close to C?
How does container tracking work?
Container tracking works by joining up physical events in the container’s lifecycle (empty release, gate in, loaded, discharged, delivered, empty return) with digital events from carriers, terminals, AIS (Automatic Identification System) vessel positions, forwarders and your own PO or order data.
A modern platform standardises all those events into one timeline, then uses that timeline to predict estimated time of arrival (ETA) and flag exceptions before they turn into missed DIFOT or extra charges. This is true whether you’re doing simple container number tracking or full sea freight tracking for hundreds of boxes.
What container tracking actually means inside supply chain teams
So container tracking isn’t a pretty vessel map. It’s a decision grade stream of events tied to the actual box your live answer to “what risk do we have on containers today, and what should we do about it?”
Write down the 5–10 questions your business must answer every day, such as:
- “Which containers are at risk of missing the customer delivery window?”
- “Where are we burning free time right now?”
- “Which suppliers consistently hand over late?”
Any tracking solution or container tracker you invest in should answer those questions in one or two clicks.
The full container lifecycle: From empty release to empty return
Most tracking conversations start at “vessel departed” and end at “vessel arrived”. That’s only the middle. From a tracking perspective, a container’s lifecycle is a loop.
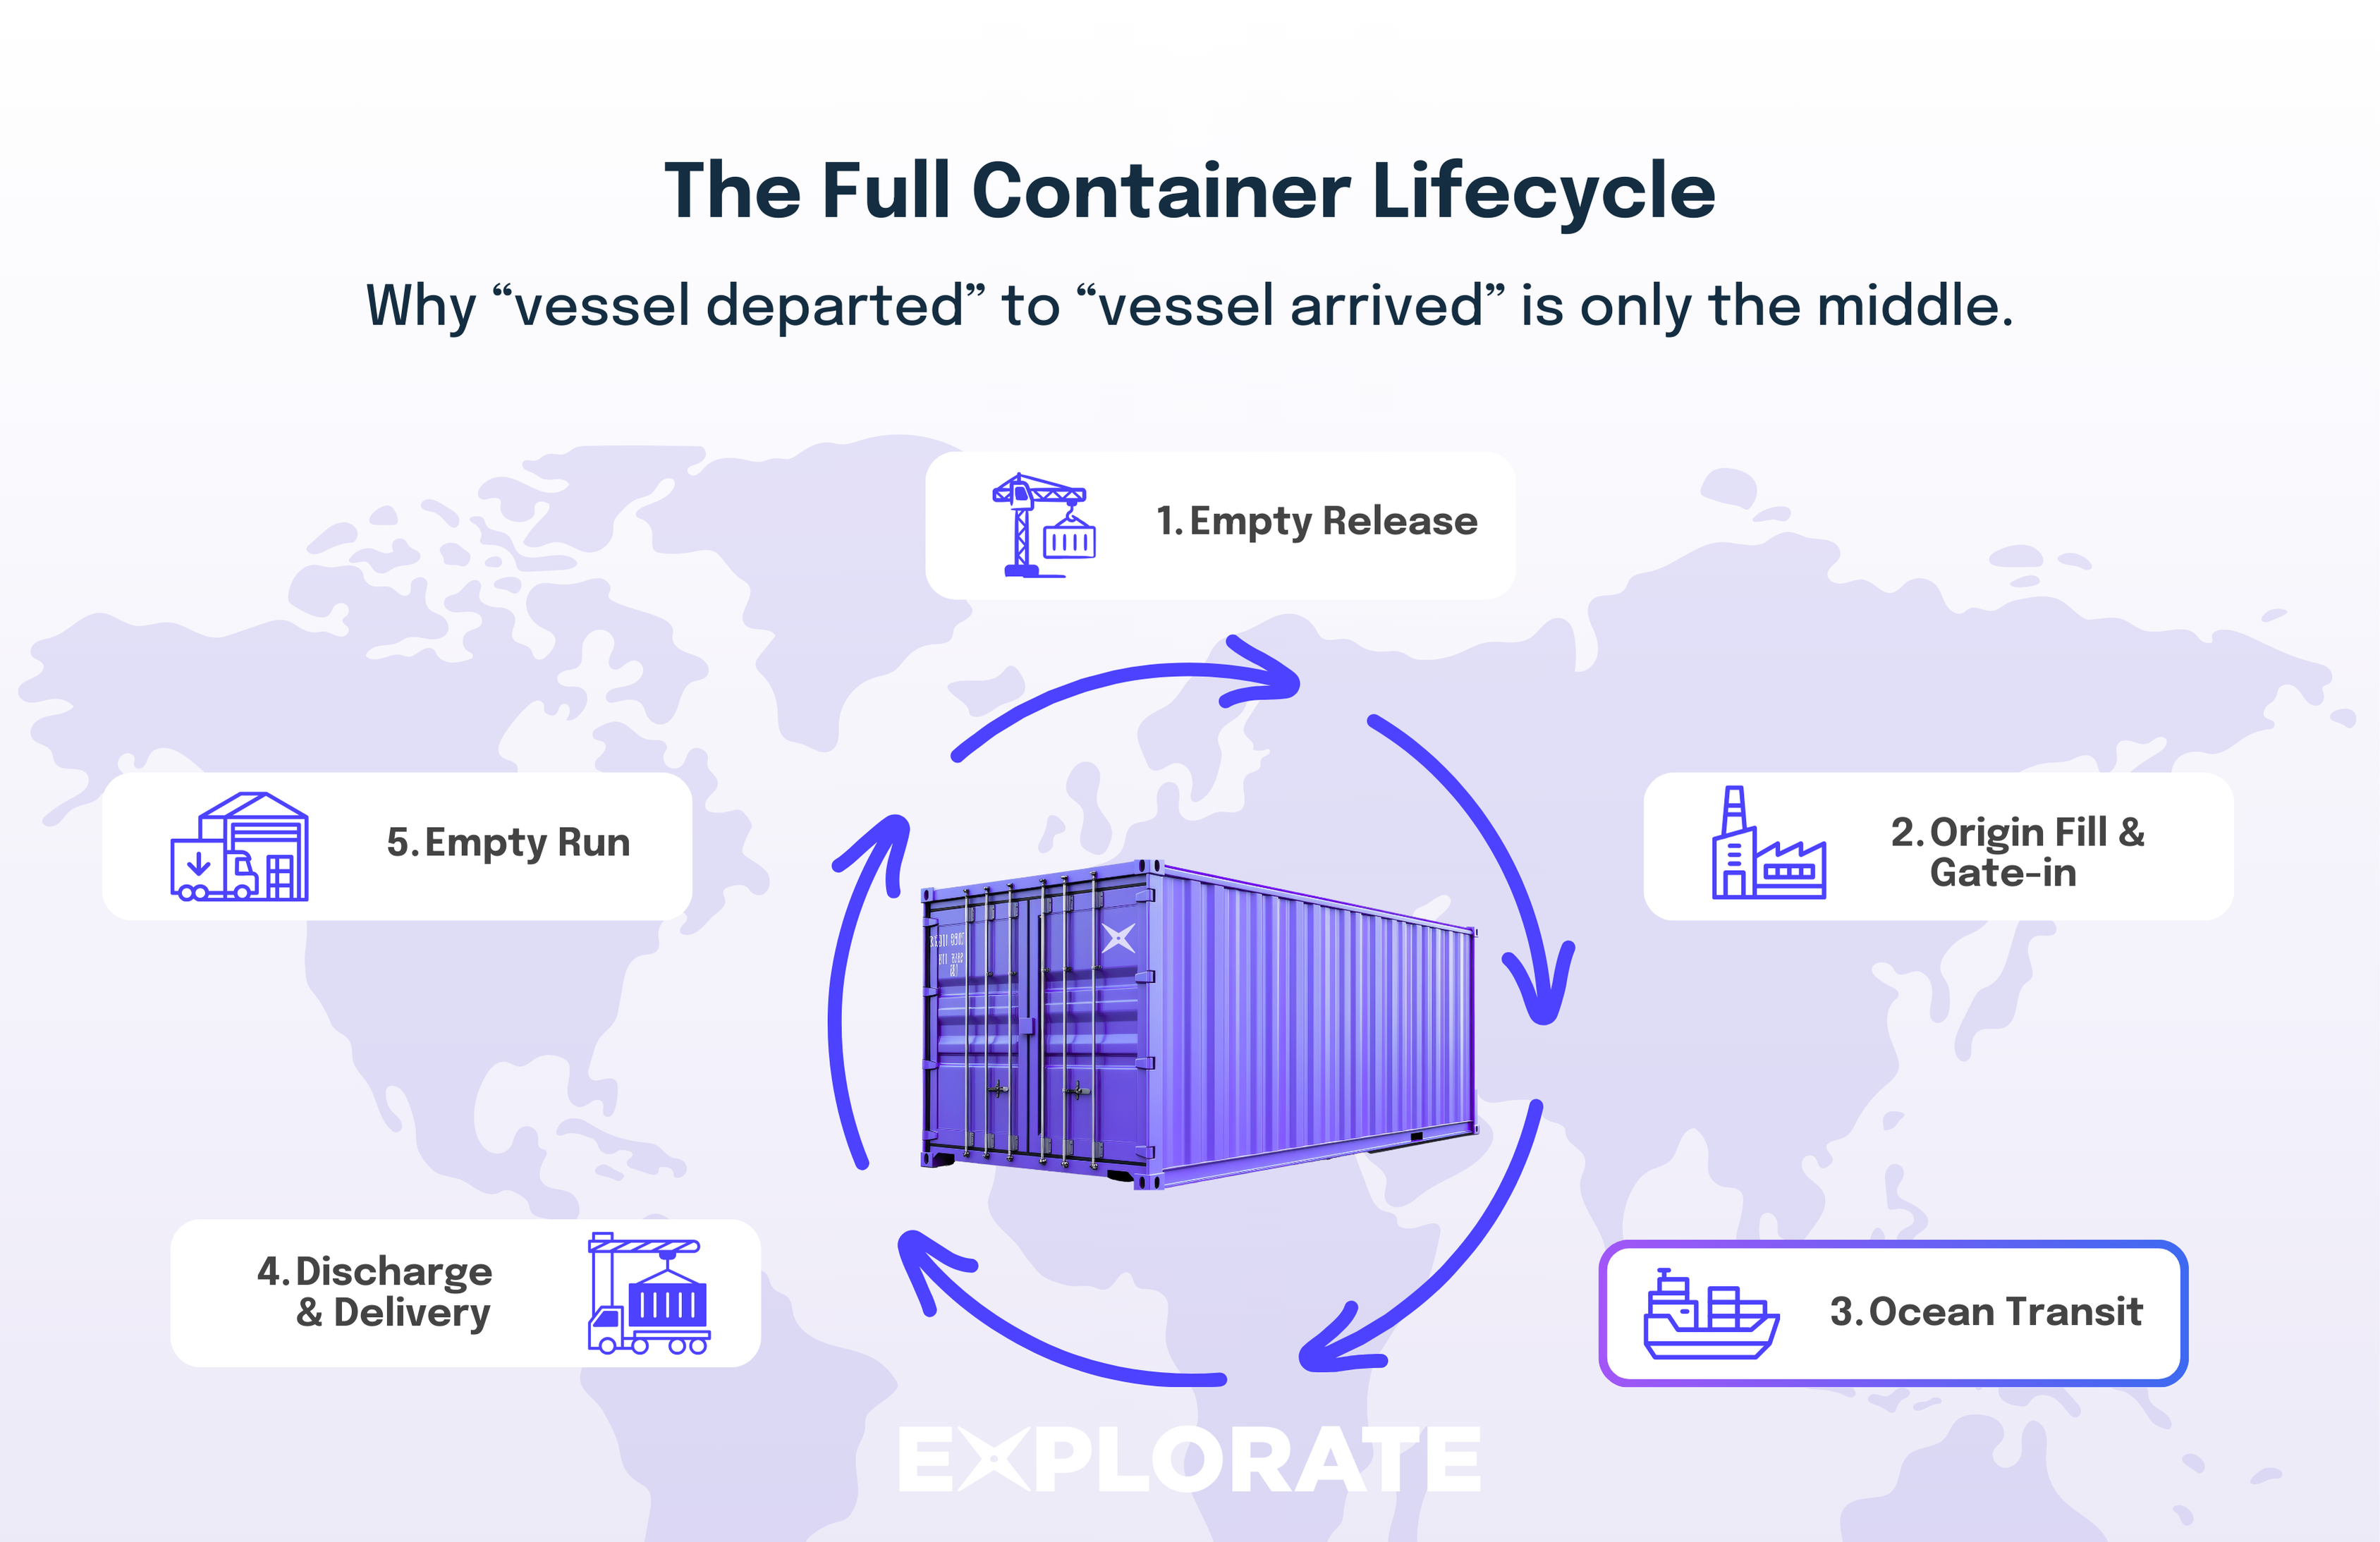
A container’s lifecycle consists of several distinct stages that form a continuous loop:
- Empty released from depot at origin.
- Stuffed and sealed at supplier.
- Delivered full to origin terminal and gated in.
- Loaded on vessel and sails.
- Possibly transshipped through a hub.
- Discharged at destination terminal.
- Cleared by customs and biosecurity.
- Picked up and delivered to your warehouse or distribution centre (DC) / 3PL site.
- Unloaded and returned empty to a depot.
If you’re not tracking the full container loop, you’ll always have blind spots on cost and risk even if your sea freight tracking looks solid while the container is “on the water.”
Origin leg: From empty release to vessel departure
This is where tracking gets messy and where a lot of teams first feel the pain of manual container searches and tracking everything in spreadsheets.
What actually happens
- The shipping line releases an empty container from a depot.
- A trucker collects it using a release number or Equipment Interchange Receipt (EIR).
- The empty is delivered to your supplier for packing.
- The container is stuffed, sealed and effectively becomes “live cargo”.
- It’s trucked to the terminal and scanned at the gate.
- The terminal loads it onto the vessel; the carrier confirms departure.
Before that gate-in scan, most data is self-reported by suppliers, forwarders and truckers in emails, phone calls or PDFs. That means:
- Inconsistent terminology.
- Missing timestamps.
- Delayed updates.
- Containers that “exist” in someone’s spreadsheet but not yet in any port system.
Data confidence jumps once the terminal scans the container on entry and again when the vessel load is confirmed.
Ocean leg: Main sailing and transshipment
This is the longest, often most opaque part of the journey.
You rely mainly on two signals:
- Carrier events – “Loaded”, “Departed”, “Arrived”, “Discharged”, “Transshipped”.
- AIS vessel data – where the ship is in real time, using terrestrial receivers near coasts and satellite AIS offshore.
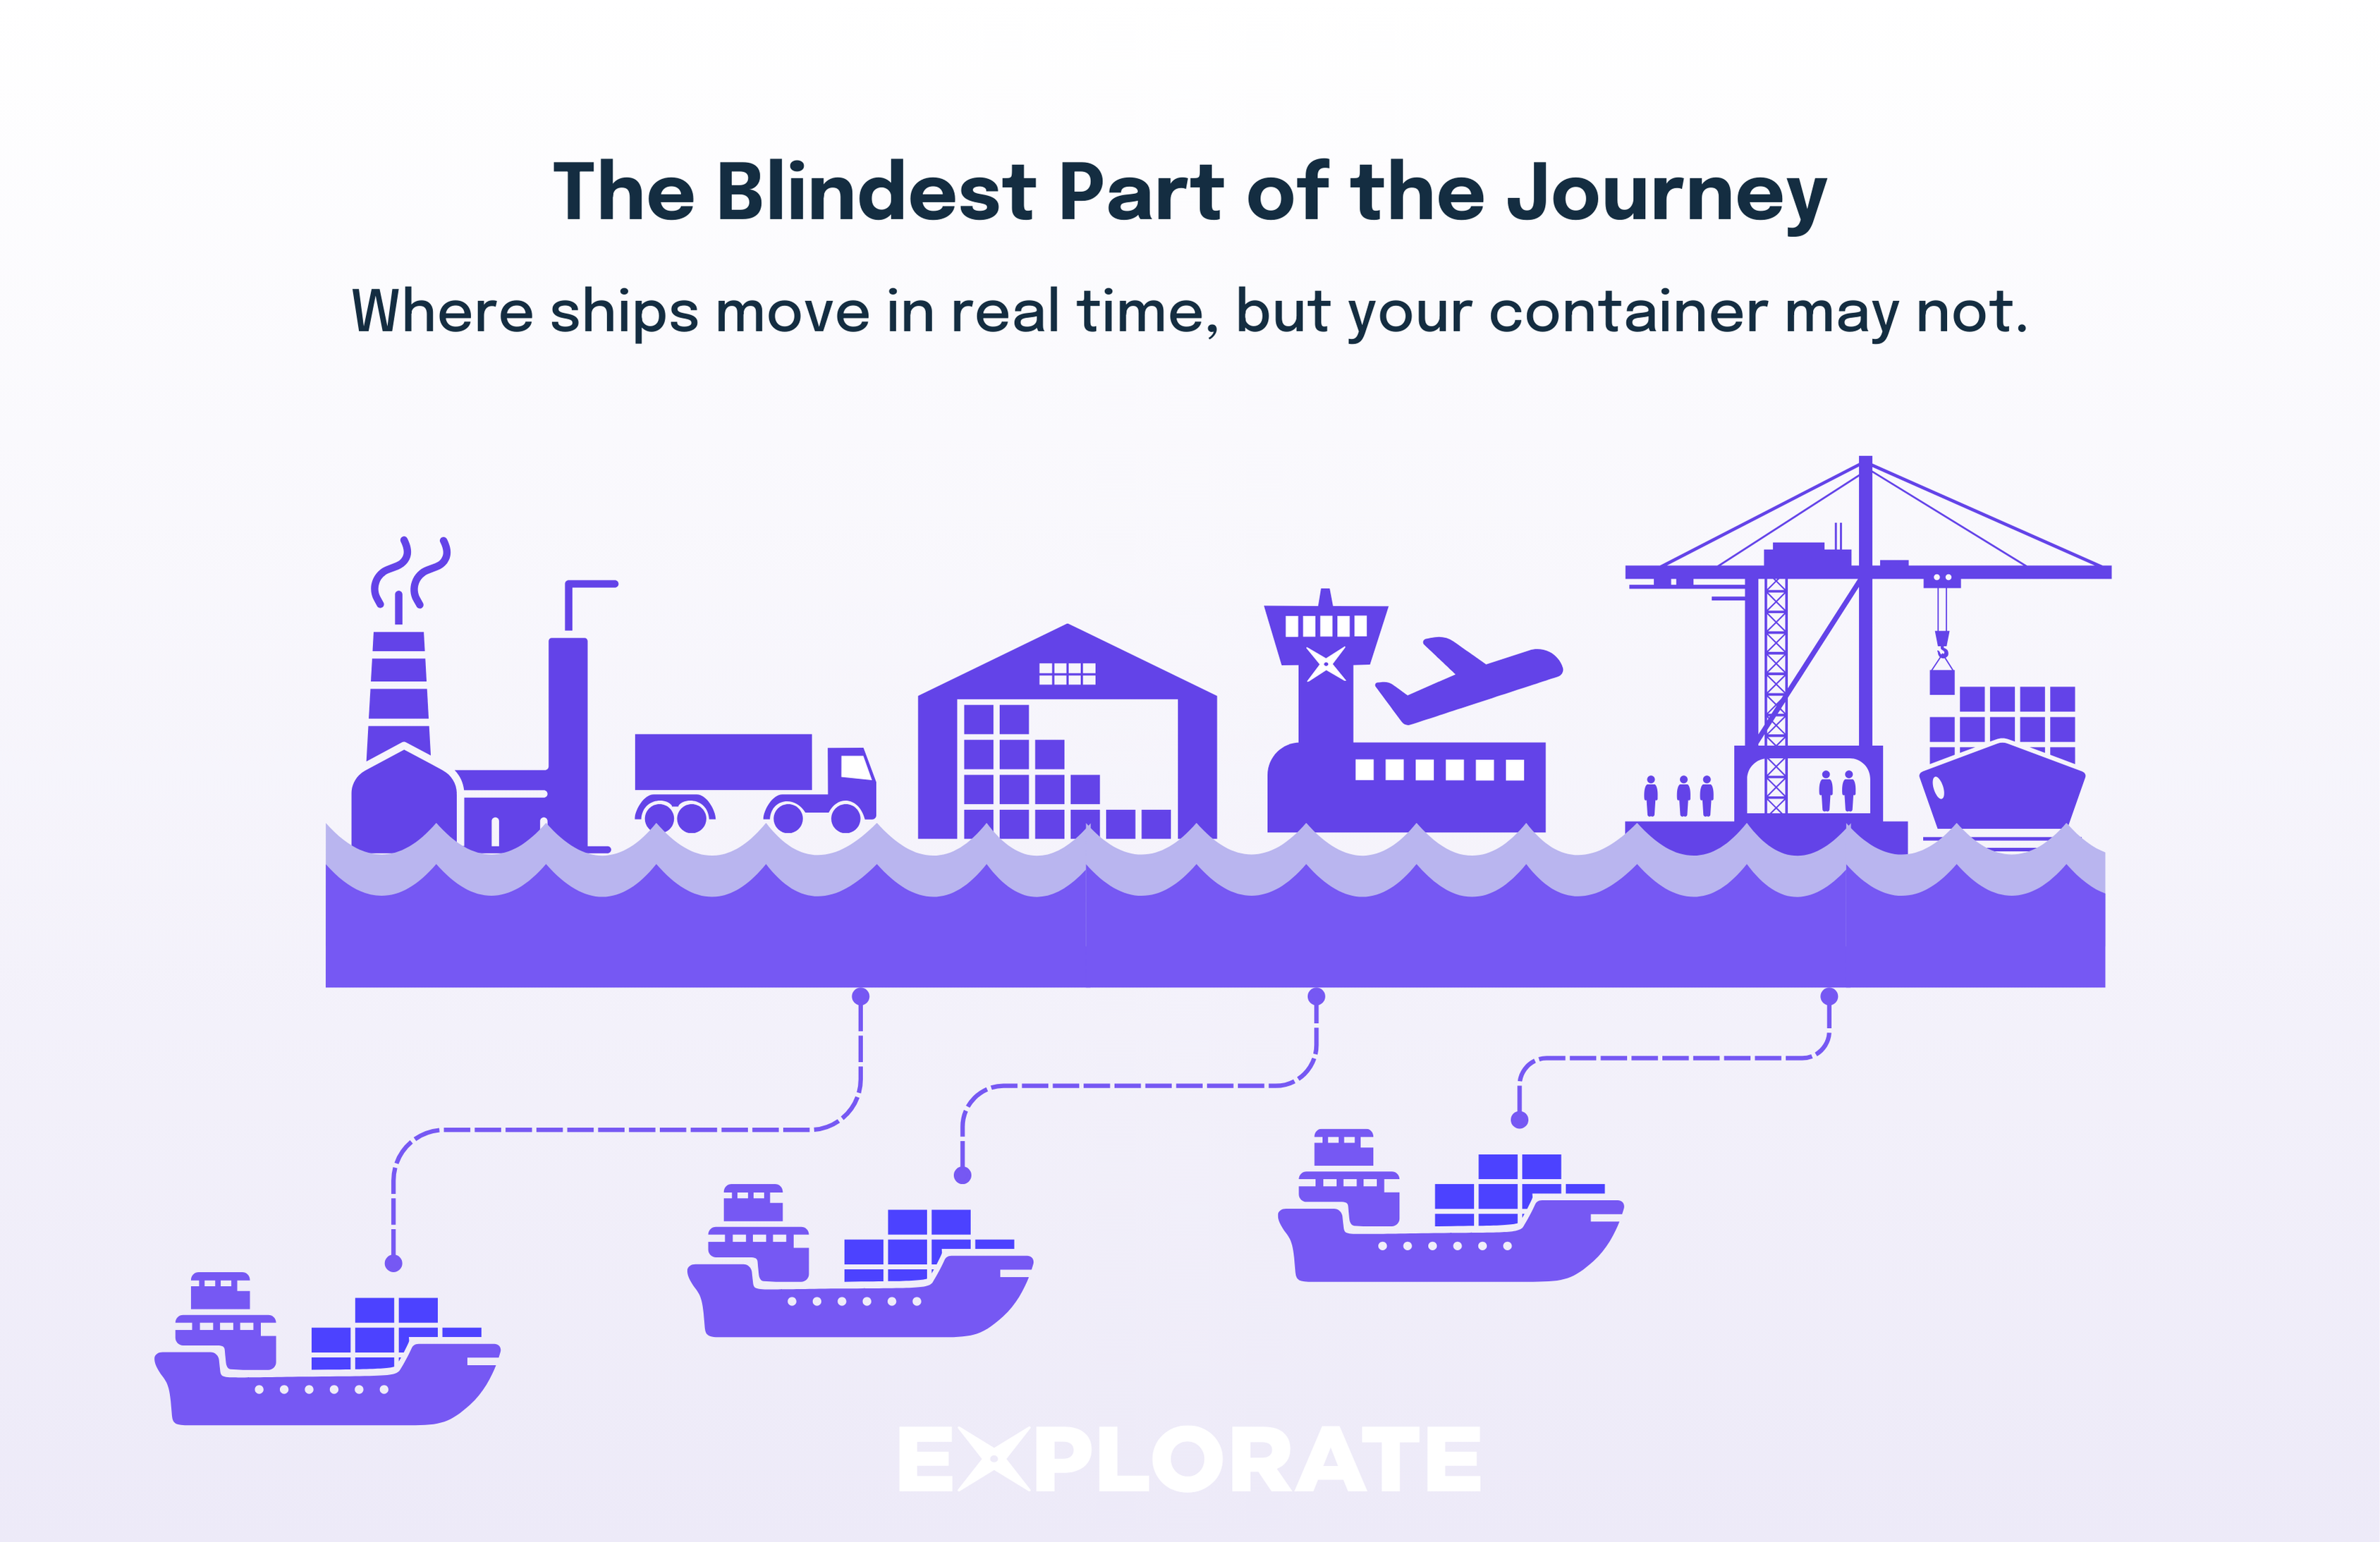
AIS is excellent for understanding where the ship really is and whether a schedule is slipping. But AIS only knows about ships, not your specific container. The vessel can sail on time while your box is still on the quay.
That’s why rolling and blanking still surprise teams:
- Rolling – your booking is moved to a later vessel (space, weight, operational issues). The ship you thought you were on leaves without you.
- Blanking – a scheduled call or voyage is cancelled or a port is skipped entirely, often to manage capacity or congestion.
Transshipment makes data worse
When your container transships through a hub (e.g. Singapore or Tanjung Pelepas):
- It’s handled by a different terminal.
- It may move onto another vessel or even another carrier (on-carriage).
- Events can be late, missing or partially updated.
This is exactly where relying on just one source, a carrier site, AIS app, or forwarder email is most likely to give you the wrong picture, especially when you’re checking container number status for a critical shipment.
Check if your current tracking view distinguishes between:
- “Vessel position” (AIS) and
- “Container loaded/discharged” events.
For your top 5 lanes, review a recent shipment with transshipment. How long did it take from actual transshipment to you seeing an update?
Destination leg: Arrival to empty return
The destination leg is the final stage of a container’s journey, beginning when the vessel arrives at the destination port and ending when the container is delivered to the consignee or final warehouse. Tracking often feels more reliable in this stage because you are closer to the final milestone and terminals/depots typically generate clear “available”, “picked up”, and “empty returned” events. Even if the underlying data quality isn’t dramatically better, the shorter remaining lead time means ETA errors are usually measured in hours rather than days.
What actually happens
- The vessel arrives and your container is discharged into the terminal yard.
- Customs and biosecurity may place holds or clear the container.
- The terminal marks it “available for pickup”.
- A trucker books a slot, gates out full and delivers to your warehouse/DC/site.
- The container is unpacked.
- The empty is returned to an agreed depot and gated in empty.
Two milestones matter more than most teams realise:
- Available for pickup – when you can act. Free days often start from discharge or the next day, not when you first notice the container. Delays in arranging transport eat into free time.
- Gate in empty – when detention stops accruing
In many ports, free storage days at the terminal start when the container is made available for collection, not when the vessel arrives. How quickly you can actually pick it up then depends on slot availability, trucking capacity, and depot opening hours. Separately, detention (container hire) starts based on the carrier’s rules, so delays in this stage can quickly turn into extra cost.
Wharf storage from the terminal plus detention from the line is one of the fastest ways to destroy the margin on a shipment.
Empty parks and depot capacity can also cause problems. If a depot refuses empties or has long queue times:
- Trucks miss booked slots.
- Empties are re-routed.
- You can get hit with extra days of detention.
Example: “Technically available”, practically invisible
A container into Sydney clears customs on Friday and is marked “available” that afternoon. Nobody noticed until Monday’s report. Free time started on Friday. By the time a truck is booked and the box is collected, you’ve burned multiple days of free time and started paying wharf storage.
Data confidence changes through the lifecycle
Tracking accuracy is not constant. It rises and falls with custody changes.The example below is based on a typical FCL import workflow, where the buyer is receiving the container at destination. Export flows look different in terms of who controls each leg and who can see which events, but the same pattern of confidence rising and falling still applies.
Good tracking doesn’t pretend all data is equally reliable. It shows you clearly where events are verified (scans, releases, gate moves) and where they are inferred (e.g. “likely rolled”, “ETA adjusted based on drift”).
Why relying on a single data source is a risk
Every shipment involves a web of parties. Each one sees a slice.
Carrier portals
- Strong on planned schedules and basic container events.
- Weak on terminal holds, trucking steps and some transshipment detail.
- Often show “planned” ETAs long after they’re unrealistic.
Forwarder updates
- Strong on what they’ve booked and local trucking they handle.
- Weaker on real-time vessel drift and last-minute carrier/terminal changes they haven’t processed yet.
AIS-only apps
- Strong on where the ship actually is.
- Blind to whether your container was ever loaded or discharged as expected. These tools are closer to container ship tracking than true container tracking across the lifecycle.
Terminal feeds
- Excellent once the box hits the wharf.
- Tell you nothing about origin issues or rolling before departure.
If you rely on just one of these:
- you can celebrate an “on-time” vessel while your container is still sitting in the origin yard
- you can think a container is delayed when the ship is on time but customs has placed a hold
- you can miss that an empty hasn’t gated in, and detention is piling up in the background
Modern visibility is about cross-checking these views, resolving conflicts and surfacing the truth. The right shipping container tracker will pull all of these into one place so you don’t have to run a manual container search every time someone asks you to track container number XYZU1234567.
How modern container tracking platforms actually work
Under the hood, most modern platforms (including Explorate) do three simple but powerful things. Think of them as your digital container tracker for tracking shipping containers end to end.
1. Pull data from multiple sources
- Carrier and Non-Vessel Operating Common Carrier (NVOCC) events.
- AIS vessel positions (terrestrial and satellite).
- Terminal and depot milestones.
- Forwarder status updates.
- Your internal data: POs, stock keeping units (SKUs), allocations, customers.
All those disconnected updates land in one place instead of ten different inboxes and spreadsheets. This is where container number tracking, sea freight tracking and exception management finally come together.
2. Normalise events into one milestone language
Supply chain data is full of synonyms:
- “CY In”, “Full In”, “FCL Received” – all describing a full container arriving at the terminal (CY = Container Yard).
- “Gate Out”, “Delivered”, “Out Gate” – variations of the same step.
If you don’t standardise, you can’t compare performance across carriers or lanes.
The platform maps all of that to a clean, consistent milestone set, such as:
- Empty Released.
- Gate In Full.
- Loaded on Vessel.
- Departed.
- Arrived.
- Discharged.
- Available for Pickup.
- Gate Out Full.
- Gate In Empty.
3. Predict ETAs and flag exceptions early
Once events are standardised and stitched into a timeline, the system can:
- adjust ETA when AIS shows the vessel slowing or queuing offshore
- infer that a container has rolled if there’s no “loaded” event by cut-off
- flag growing dwell time under a customs or biosecurity hold
- highlight containers approaching the end of free time at terminal or in detention
You don’t need to be technical to use this. You just need a clear set of rules for what should be flagged and when. That’s the difference between a basic “track container” view and a true shipping container tracker that drives action.
Template: Daily exception review
Use something like this with your team:
- Start with exceptions, not a status tour
“Show me all containers with: holds, ETA slips >2 days, or free time <48 hours.” - Assign ownership
- Who will chase the forwarder/carrier?
- Who will adjust customer promise dates?
- Who will chase the forwarder/carrier?
- Log decisions
- Re-bookings, priority containers, mode shifts.
- Re-bookings, priority containers, mode shifts.
- Close the loop
- Did yesterday’s actions change today’s risk?
- Did yesterday’s actions change today’s risk?
With a platform like Explorate, the system surfaces the problem containers; your team decides what to do. You move from manual container search to structured exception handling.
Moving from spreadsheet hell to real-time, carrier-agnostic tracking
Spreadsheet tracking is fine, until you hit a certain scale:
- Multiple forwarders.
- Several origin regions (e.g. East China, SE Asia, Europe).
- 40–50+ FCLs a month.
- AU ports with tight free time and expensive storage.
At that point, “just one more tab” stops working. Container tracking becomes too big to manage with ad-hoc container number tracking and manual “track container” checks. Here’s a practical way to move towards World C.
Step 1: Map your lifecycle and data sources
For one high-volume lane (say Ningbo → Brisbane):
- List each milestone from empty release to empty return.
- For each milestone, write where you currently get the data (portal, email, spreadsheet, phone call).
You’ll quickly see where you are blind or relying on one person’s memory.
Step 2: Standardise your milestones
Agree a standard naming convention:
- Don’t let each forwarder invent its own.
- Use 10–15 milestones that everyone understands.
Example schema (adapt for your business):
- Booking confirmed
- Empty rceleased
- Gate in full (origin)
- Loaded on vessel
- Vessel departed
- Vessel arrived (port of discharge)
- Discharged
- Available for pickup
- Gate out full
- Delivered
- Gate in empty
Once you have this, you can ask a platform like Explorate to map carrier-specific events into your language. At that point you’ve effectively built your own container tracking and trace model for every shipment.
Step 3: Pilot on one lane or business unit
Don’t boil the ocean.
- Pick a lane where fee and service risk hurts most (e.g. your main China → AU lane).
- Move tracking for that lane into a platform first.
- Keep a “before vs after” log: surprises, fees, number of emails, time in spreadsheets.
Example: Before vs after (simplified)
- Before: 3 portals, 2 forwarder reports, 1 master spreadsheet, 20+ emails a week.
- After: 1 Explorate view, daily exception list, 5–10 targeted emails a week.
Step 4: Plug tracking into your ERP/TMS and planning processes
Real-time tracking only creates value if it feeds your existing systems and rhythms:
- Update promised delivery dates in your ERP / order system.
- Inform replenishment and allocation decisions.
- Feed Sales & Operations Planning (S&OP) / Integrated Business Planning (IBP) with realistic inbound dates.
- Give finance a clear view of inventory on water.
Key takeaways

Supply Chain Specialist with 15+ years of experience spanning manufacturing, inventory control, freight forwarding, and software development. Damo excels at uncovering hidden operational and commercial opportunities, always driving continuous improvement to push the boundaries of success.
-
Frequently Asked Questions
Explorate gives supply chain managers one real-time view across ever forwarder, lane and mode without replacing your current process, partners or systems.

